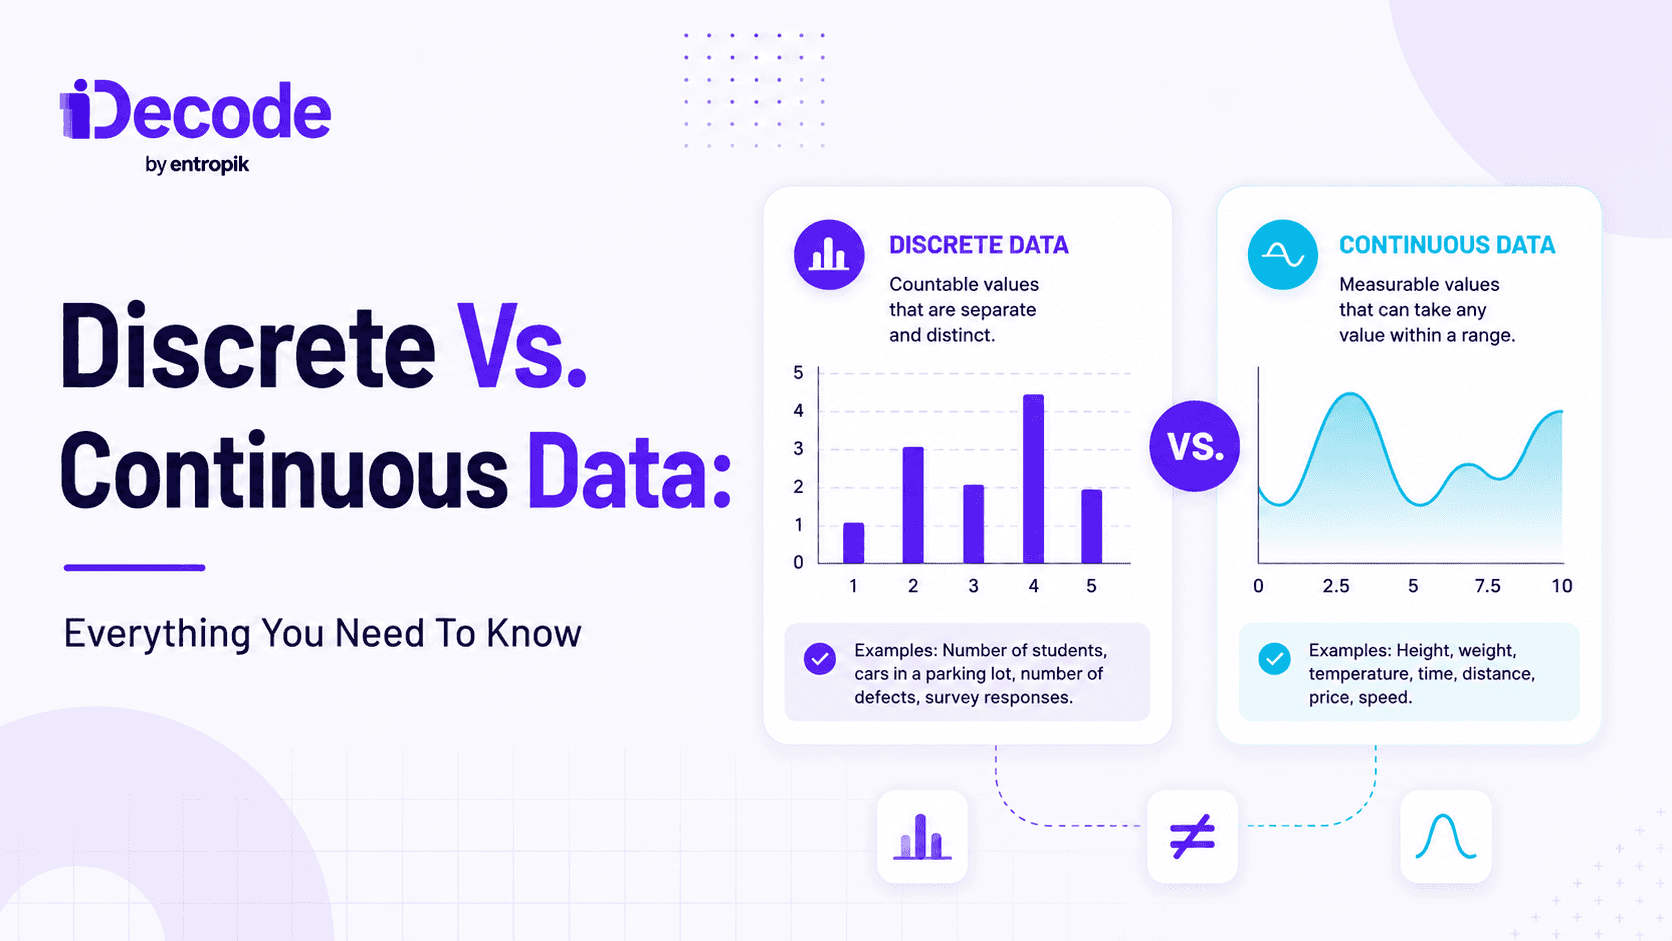
Discrete data consists of specific, countable whole-number values, like the number of daily product sales, while continuous data can take any value within a range, such as time spent on a site. Discrete data reveals broad patterns; continuous data adds granular detail, and together they give a fuller view of customer behavior.
Quantitative data is all about numbers you can measure, and it’s essential for figuring out how well your products or teams are doing.
There are two main types of quantitative data: discrete and continuous. Knowing the difference between them helps you collect the right information and make smarter decisions.
In this article, we’ll break down what discrete and continuous data mean, look at some real-world examples, and see how they’re different.
What is Discrete Data
Discrete data is information that comes in specific, separate values, usually whole numbers you can count. You can't break these values down into smaller parts, so there are no in-betweens. You'll see discrete data whenever you're counting things or sorting them into categories.
Real-Life Example of Discrete Data
Think about a retail store tracking how many products it sells each day. If they sell 50 items on Monday, 45 on Tuesday, and 60 on Wednesday, those numbers are discrete data. Each one is a whole number, after all, you can't sell half a product.
Discrete Data in Research
In research, you'll use discrete data when you're counting things or sorting responses into groups. Picture a survey asking high school students how many books they read in a month. One student reads 2 books, another reads 5, and someone else reads none. Each of these numbers is a clear, whole value, classic discrete data.
Research Example
Consider a psychological study investigating the frequency of a specific behavior among participants. Suppose researchers are examining how many times individuals check their smartphones in a day. Participants report their usage as follows:
Participant A: 25 times
Participant B: 30 times
Participant C: 15 times
These numbers are discrete data points. They represent distinct counts of behavior and cannot be fractional. By analyzing this data, researchers can identify patterns, such as the average number of times participants check their smartphones daily, and conclude smartphone usage habits. This kind of research has never been more relevant. According to Q3 2025 data from Backlinko, people now spend an average of 5 hours and 16 minutes online on their smartphones every day, making discrete counts of phone interactions a key data point for understanding the impact of smartphone use on daily life and mental health.
What is Continuous Data
Continuous data is information that can take on any value within a range. Unlike discrete data, you can break it down into smaller and smaller pieces, there are endless possible values between any two points. You'll see continuous data when you're measuring things, like height or temperature, where fractions and decimals make sense.
Real-Life Example of Continuous Data
Take measuring people's heights as an example. One person might be 170.2 cm tall, another 165.5 cm, and someone else 180.3 cm. These are continuous values because you can measure height as precisely as your tools allow, there's always a possible value between any two measurements.
Continuous Data in Consumer Research
In consumer research, continuous data helps you dig into the details of how people behave and what they prefer. This kind of insight lets businesses make smarter choices about products, marketing, and customer service.
Consumer Research Example
Picture a team tracking how much customers spend on groceries each month. They collect the actual amounts spent by different people, like:
Customer A: $150.75
Customer B: $200.50
Customer C: $175.30
These spending amounts are continuous data, you can measure them down to the cent, and there's no limit to how precise you can get. Counting the number of purchases would be discrete data, but tracking the amount spent gives you a much richer picture.
Looking at this continuous data lets you spot patterns, like average spending, differences between customer groups, and changes over time. These insights help businesses understand how people shop, adjust their marketing, and fine-tune pricing. For instance, if you notice customers spend less in certain months, you might run special offers to encourage more sales.
Difference Between Discrete and Continuous Data
Feature | Discrete Data | Continuous Data |
Definition | Data that can only take specific, separate values | Data that can take any value within a given range |
Nature | Countable | Measurable |
Values | Whole numbers | Can include fractions and decimals |
Examples | Number of students in a class, number of products sold | Height, weight, temperature, time spent |
Measurement | Counting | Measuring |
Intermediary Values | No intermediary values between distinct points | Infinite possible values between any two points |
Graph Representation | Bar charts, pie charts | Histograms, line graphs |
Data Type | Often categorical | Often numerical |
Typical Use Cases | Inventory counts, survey responses | Scientific measurements, time tracking |
Precision | Limited to whole numbers | Can be as precise as the measuring instrument allows |
Summarization | Frequencies, counts | Averages, standard deviations, ranges |
Example in User Research | Number of times a feature is used | Duration of time spent on an app |
Example in Consumer Research | Number of purchases made | Amount of money spent |
Importance of Discrete Data in Building Better Marketing and Product Experiences
Discrete data is key for marketing and product development because it gives you clear, countable numbers to guide your decisions. Here's how it helps:
Customer Segmentation
You can use discrete data to sort customers into groups, by age, gender, how often they buy, or what they like. This makes it easier to run targeted marketing campaigns that speak directly to each group's needs. And the payoff is real: McKinsey research shows that businesses using modern segmentation approaches are seeing 86% higher ROI than those stuck with basic demographics. Meanwhile, AI-driven customer segmentation can increase marketing ROI by 25–40% and significantly improve customer engagement and retention rates.
Behavioral Analysis
Counting things like ad clicks or how often people use a feature helps you see what's working and what grabs users' attention.
Performance Metrics
Discrete data gives you simple metrics, like units sold, new users, or how often something happens. These numbers are essential for measuring how well your marketing or product features are performing.
Customer Feedback
Survey answers and reviews often give you discrete data, like ratings or yes/no responses. This helps you measure customer satisfaction and spot where you can improve.
Importance of Continuous Data in Building Better Marketing and Product Experiences
Continuous data works alongside discrete data by giving you detailed, measurable insights to fine-tune your marketing and product strategies. Here's what it brings to the table:
Understanding Trends
Continuous data, like how long users spend on your site or app, helps you spot patterns and trends. This is key for making the user experience better and boosting engagement.
Personalization
With continuous data, you get a deeper look at what customers like and how they behave. For example, knowing the average amount people spend lets you create personalized offers and recommendations, which keeps customers happy and coming back. The numbers back this up: according to McKinsey, personalization marketing can reduce customer acquisition costs by as much as 50%, lift revenues by 5 to 15%, and increase marketing ROI by 10 to 30%. And it compounds over time, companies with faster growth rates derive 40% more of their revenue from personalization than their slower-growing counterparts.
Performance Optimization
Continuous data is crucial for A/B testing and tracking performance. By measuring things like load times, conversion rates, or which marketing messages work best, you can keep improving your strategies and products. Today, 81% of organizations use analytics or AI to support major decisions and those that build strong data cultures make decisions up to 5x faster than those that don't.
Predictive Analytics
Continuous data also powers advanced analytics, like predictive modeling. By spotting trends in this data, you can forecast what customers might do next and adjust your marketing or product plans ahead of time. Gartner predicts that by 2026, half of all business decisions will be augmented or automated by AI agents, which means the continuous data feeding those models is more valuable than ever.
Integration of Discrete and Continuous Data
Bringing together discrete and continuous data gives you a complete picture of how customers behave and what they want. Here's how using both types can improve your marketing and product experience:
Holistic Customer Insights
Discrete data gives you the big categories, while continuous data fills in the details. Using both helps you understand the whole customer journey, from broad patterns to specific actions. This matters more than ever: data-driven firms are 23 times more likely to acquire customers than those relying on gut feel alone.
Enhanced Decision Making
When you combine both types of data, you can make smarter decisions. For example, knowing how often people buy a product (discrete) and how much they spend on average (continuous) helps you set better prices and manage inventory.
Balanced Performance Metrics
Discrete data gives you clear numbers to track, while continuous data adds context and depth. For instance, tracking app downloads (discrete) together with average session length (continuous) gives you a much better sense of user engagement.
Targeted and Efficient Marketing
Discrete data helps you find your target segments, and continuous data shows you the best times and channels to reach them. This means your marketing campaigns can be more focused and effective.
Conclusion
Both discrete and continuous data are essential for building better marketing and product experiences. Discrete data gives you clear, countable numbers, while continuous data adds detail and depth. Using both helps you truly understand your customers, make smarter decisions, and keep improving what you offer. In 2026, with AI reshaping how we analyze and act on data, the fundamentals haven't changed, they've only become more powerful.
Frequently Asked Questions
What is the difference between continuous and discrete data?
Discrete data is made up of countable, separate values, like sales numbers or how many students are in a class. You'll usually see it shown in bar or pie charts. Continuous data covers a range of values, like height or temperature, and is often shown in histograms or line graphs for more detailed analysis.
What is an example of discrete data?
Discrete data is all about distinct, countable values, like the number of students in each class (20 in Class A, 25 in Class B, 30 in Class C). It's perfect for situations where you're dealing with whole numbers that can't be split up any further.
What is an example of continuous data?
Continuous data, like student heights (150.5 cm, 155.2 cm, 162.1 cm), can take on any value within a range, even fractions and decimals. You'll use it when you need precise measurements, especially in science or research where detail matters.
Related Topic: