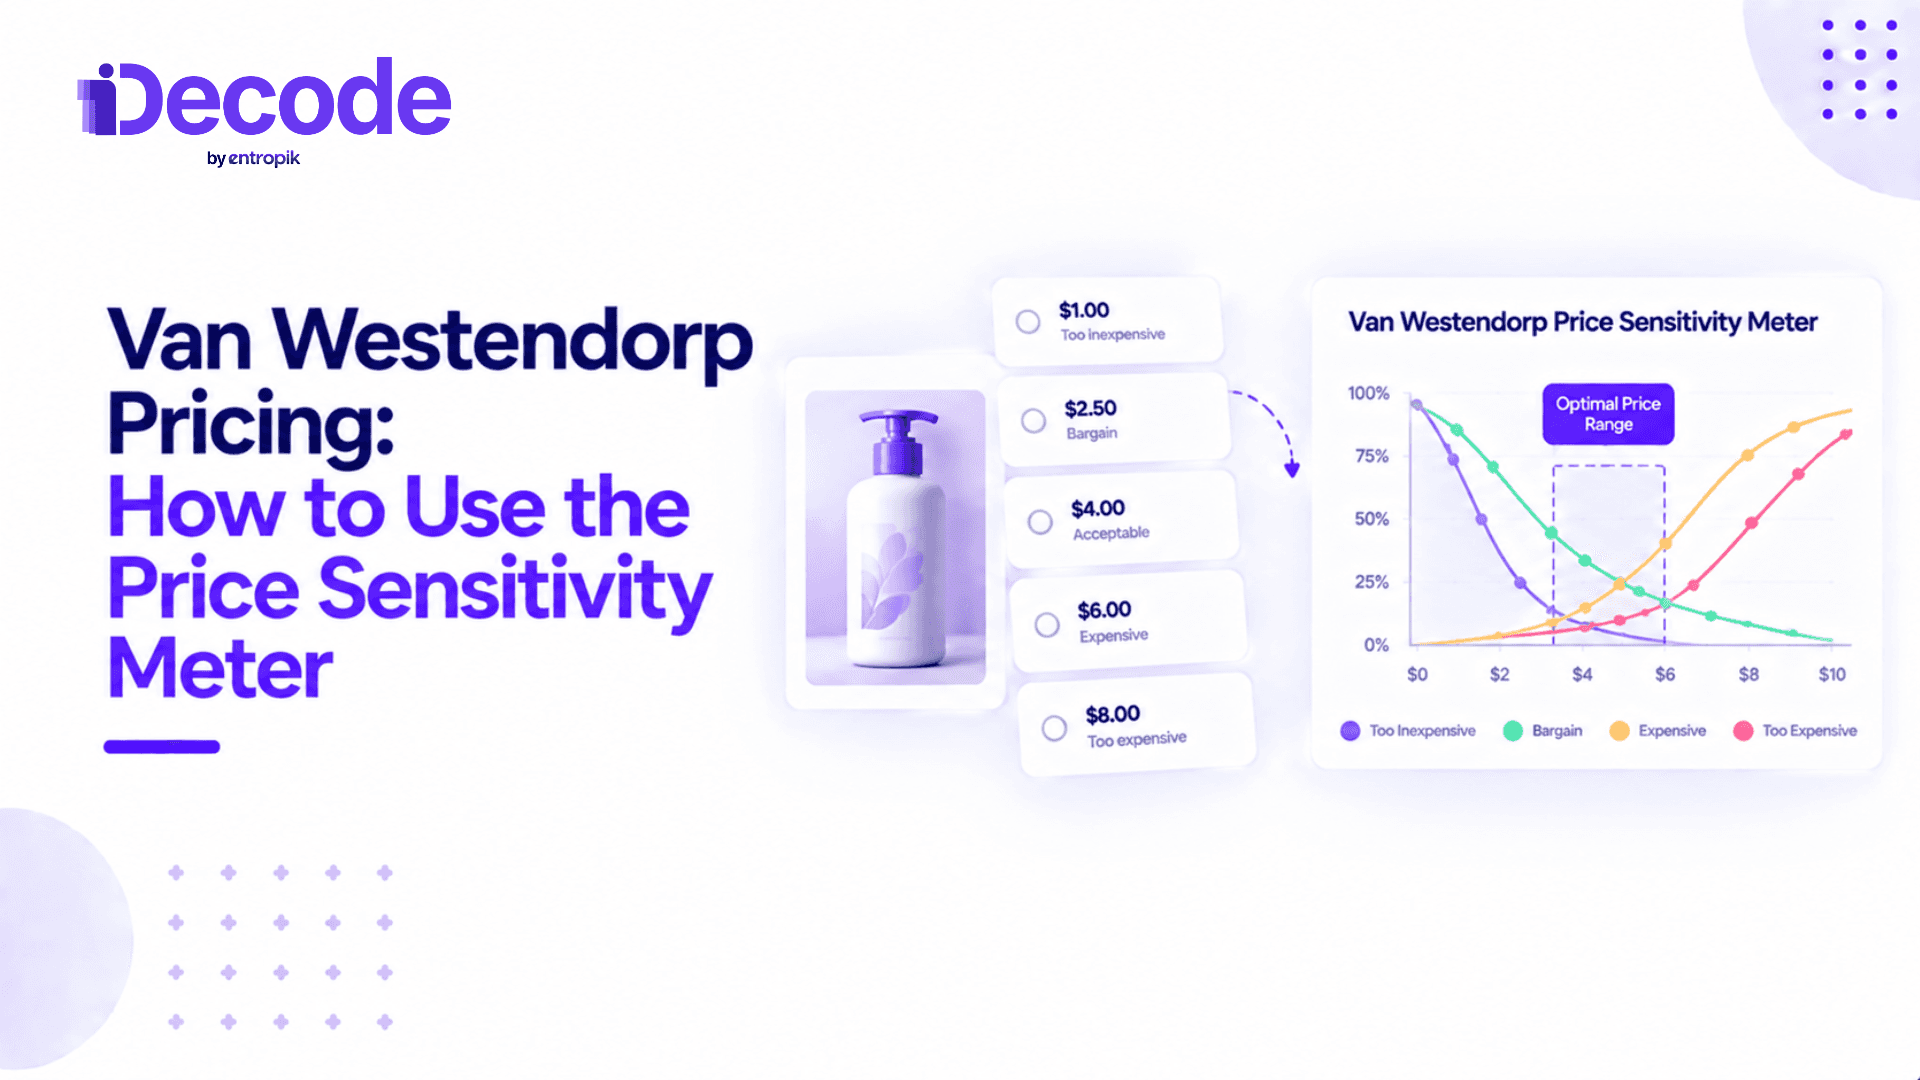
Van Westendorp pricing is a survey-based pricing research methodology that measures how customers perceive different price levels. It asks four questions about when a product feels too cheap, inexpensive, expensive, or too expensive. The responses are plotted as cumulative curves to identify an acceptable price range, optimal price point, and key price perception thresholds.
Summary:
|
Pricing affects revenue on every sale, and a small mistake is expensive. McKinsey's analysis of typical S&P 1500 company economics found that pricing just 1% below the optimal level can give up roughly 8% of a product's potential operating profit. That is why most pricing teams want evidence before they settle on a number.
The obvious approach, asking customers "What would you pay?", seldom gives a usable answer. Some people anchor on a competitor's price. Some lowball in the hope of a deal. Many simply guess. Van Westendorp pricing doesn't look for one magic figure. It asks buyers where their comfort zone starts and where it ends.
This makes it one of the more practical tools in consumer insights work. It turns vague feelings about value into a range a pricing team can argue about with data. The rest of this guide covers the four questions, how to run and analyze a study, how to read the results, a worked example, and where the method stops being useful.
What is Van Westendorp pricing?
Van Westendorp pricing is a survey-based pricing research methodology. Dutch economist Peter van Westendorp introduced it in 1976. It is also called the Van Westendorp Price Sensitivity Meter (PSM). The method asks respondents four open-ended questions about a single product and uses their answers to map how price perception shifts as the price rises.
The method does not ask for one willingness-to-pay figure. It collects each respondent's thresholds: the point where a price starts to feel suspicious, the point where it feels like a bargain, the point where it starts to feel pricey, and the point where it is out of the question. Taken together, those thresholds show a lower and an upper limit for acceptable pricing.
The Van Westendorp pricing model belongs to the wider set of methods for measuring price sensitivity. Its main outputs are an acceptable price range and four named price points, covered in detail further down.
What does the Van Westendorp Price Sensitivity Meter measure?
The price sensitivity meter measures perception. It shows the price at which a product seems too cheap to trust, good value, expensive but still worth considering, and too expensive to buy.
It does not measure behavior. Respondents describe how they would react to a price. They are not handing over money. People often say one thing and do another, and the say-do gap is especially wide on price, where hypothetical answers cost nothing.
So the PSM identifies where prices are accepted. It does not estimate demand at each price, so it cannot directly tell you price elasticity or which price maximizes revenue. Keep this distinction in mind whenever you read Van Westendorp results.
The four Van Westendorp pricing questions
Every study uses four standard questions. The wording varies slightly between practitioners, but the structure stays the same:
At what price would this product be so cheap that you would doubt its quality?
At what price would this product be a bargain, a great buy for the money?
At what price would this product start to feel expensive, though you would still consider it?
At what price would this product be so expensive that you would not consider buying it?
Every respondent should evaluate exactly the same thing: the same product, pack size or unit, currency, and billing period (for example, per month versus per year). Show everyone an identical description or visual, just as you would in concept testing. If two respondents picture different products, their answers can't be combined.
Answers are open-ended numbers. Some teams show price sliders or dropdowns instead. That is easier for respondents, but it quietly sets anchors, so use it carefully.
Too cheap
This question sets the lower extreme of acceptable pricing. Below a certain point, a low price stops looking like a deal and starts to suggest that something is wrong with the product.
This effect is more than a survey quirk. In a Caltech and Stanford study, participants tasted wines while inside a brain scanner. The researchers found that raising the stated price of a wine increased both reported pleasantness and activity in the brain region linked to experienced pleasure, even though participants were drinking the same wine labelled $5 and $45. Price shapes how people experience quality, so pricing too low can hurt a product.
Cheap or good value
This question captures the price customers link with strong value for money. It is not a quality warning. It is the point where respondents feel they are getting a good deal.
Expensive
This question finds where the product starts to feel pricey but is still under consideration. The buyer would pause and think, but would not walk away. Don't treat this threshold as the price at which purchase consideration stops.
Too expensive
This question sets the upper extreme. Above this price, respondents say they would no longer consider buying. Together with the too cheap answers, it defines the outer limits of the study.
How to conduct a Van Westendorp pricing study
A good Van Westendorp analysis depends on preparation. Before you field anything, write down the product concept, target audience, purchase unit, currency and pricing period. Most teams then run the survey through a consumer research platform so that screening, quotas and data checks happen in one place.
Next, choose who to ask. Recruit people who realistically buy in the category, either prospective or existing customers. A sample that is too broad or skewed will move every curve, and sampling error grows quickly when you later split results by segment.
Test the questionnaire before full launch. A short pilot survey will show whether respondents understand the product description and whether answers land in a sensible price zone.
After fielding, clean the data. Remove anyone whose answers are logically inconsistent. The order should always be too cheap ≤ cheap ≤ expensive ≤ too expensive. Someone who names a "bargain" price above their "too expensive" price has misread the questions or wasn't paying attention.
How to analyze Van Westendorp pricing data
The analysis converts individual answers into cumulative distributions. For each price across the relevant range, calculate the share of respondents who would put that price in each category:
Too cheap: the share whose too cheap threshold is at or above that price. This curve falls as price rises.
Cheap: the share whose bargain threshold is at or above that price. It also falls as price rises.
Expensive: the share whose expensive threshold is at or below that price. This curve rises.
Too expensive: the share whose too expensive threshold is at or below that price. It also rises.
Most practitioners then add two inverted curves. "Not cheap" is 100% minus cheap, and "not expensive" is 100% minus expensive. Put price on the x-axis and cumulative respondent percentage on the y-axis. The points where the curves cross are the outputs of the Price Sensitivity Meter.
A spreadsheet can do all of this. The work is mostly counting and plotting. The harder part is reading the result correctly.
How to interpret the Van Westendorp price points
The curve intersections produce four reference points. Two of them bound the acceptable price range. The other two sit inside it and describe how the market balances price perceptions. Note that some practitioners pair the curves slightly differently. Whatever convention you use, state it in the report.
Point of marginal cheapness (PMC)
PMC is where the too cheap curve crosses the not cheap curve. It is the lower limit of the acceptable price range. Below it, more people see the offer as suspiciously cheap than see it as reasonably priced.
Point of marginal expensiveness (PME)
PME is where the too expensive curve crosses the not expensive curve. It is the upper limit. Above it, resistance based on perceived expensiveness grows quickly.
Optimal price point (OPP)
The optimal price point is where the too cheap and too expensive curves cross. At this price, the same share of people reject the product for being too cheap as for being too expensive. The name is misleading. "Optimal" here refers to a balance of perceptions. It does not mean the price that maximizes profit or revenue.
Indifference price point (IPP)
IPP is where the cheap and expensive curves cross, or equivalently where not cheap crosses not expensive. At this price, equal shares of respondents see the product as a bargain and as getting expensive. It is often read as the market's idea of a normal price for the category.
Understanding the acceptable price range
The acceptable price range is the span between PMC and PME. For most decisions, this range is more useful than any single point inside it.
Treating the OPP as the answer gives a false sense of precision. The range gives a pricing team room to weigh margin targets, competitor positions and brand strategy. A premium brand may price near the top of the range. A challenger trying to win trial may sit closer to the IPP.
In practice, teams compare candidate prices against these pricing thresholds and drop anything outside the band. What remains is a short list for proper price testing before launch.
Van Westendorp pricing example
Say a food brand is pricing a new 400g premium granola pouch. It surveys 400 category buyers with the four questions, cleans the data and builds the curves. Here are cumulative percentages at five candidate prices:
Price | Too cheap | Not cheap | Not expensive | Too expensive |
$4.00 | 62% | 12% | 95% | 1% |
$5.00 | 30% | 30% | 85% | 4% |
$6.00 | 12% | 55% | 60% | 12% |
$7.00 | 4% | 78% | 35% | 32% |
$8.00 | 1% | 92% | 15% | 58% |
Reading the crossings:
PMC is about $5.00, where too cheap and not cheap both reach 30%.
OPP is about $6.00, where too cheap and too expensive both reach 12%.
IPP is about $6.20, where not cheap overtakes not expensive between $6 and $7.
PME is about $7.10, where too expensive overtakes not expensive just past $7.
The acceptable range is therefore about $5.00 to $7.10. A price of $4.49 looks risky, because it falls below the point where quality doubts start. A price of $7.99 is outside the range altogether. The team might shortlist $5.99, $6.49 and $6.99, and then measure purchase intent at each one to see which balances volume and margin.
When to use Van Westendorp pricing
The Van Westendorp method works best when acceptable price boundaries are uncertain. Typical cases are launching a new product, repositioning an existing one, changing features, or entering a market with unfamiliar price norms. At the very early stage, some teams run the four questions with synthetic respondents first to get a rough sense of where the price range might fall. The real study with category buyers then decides the range.
There's plenty of room for this kind of evidence. A Bain & Company survey of executives at more than 1,700 companies found that roughly 85% believed their pricing decisions could improve. Van Westendorp research offers a fast, low-cost first step.
It only works if respondents understand what they are pricing. When the offer is still vague, validate the idea first, for example with AI moderated concept testing. Price the product once people can describe what they would be buying.
Benefits of the Van Westendorp method
It is short. Four core questions fit easily into a larger survey without much added fatigue.
It gives both boundaries. You learn where resistance starts at the top and where credibility breaks down at the bottom, not just a single stated figure.
It exposes the risk of pricing too low. Many teams worry only about overpricing. The too cheap curve shows when a discount starts to damage perceived quality.
It is easy to explain. Stakeholders who have never seen a demand curve can follow four crossing lines on a chart.
Limitations of Van Westendorp pricing
The biggest limitation is that stated price perceptions do not reliably predict purchases. A meta-analysis of 77 studies from the University of Groningen found that hypothetical willingness to pay overstated real willingness to pay by about 21% on average. The gap was larger for higher-value and specialty products.
The classic method also leaves out important context. Respondents usually price the product on its own, without competitor prices in front of them. They can't trade off features against price. The output also gives no estimate of demand or price elasticity.
Finally, the results are only as good as the respondents' grasp of the offer. For new or complex categories, people may not have a realistic sense of price at all. That is one reason survey data alone rarely settles a pricing decision.
Van Westendorp vs. other pricing research methods
Each pricing research method answers a different question:
Method | What it asks | What it tells you |
Direct willingness to pay | "What is the most you would pay?" | One stated figure, prone to anchoring |
Van Westendorp | Four price perception thresholds | Acceptable price range and reference points |
Gabor-Granger | Purchase likelihood at a set of prices | Demand curve and a revenue-maximizing estimate |
Conjoint | Choices between product and price combinations | Value of each feature and feature-price trade-offs |
Van Westendorp is about perception. Gabor-Granger estimates purchase likelihood at specific prices. Conjoint analysis goes further and shows how much each feature is worth relative to price.
Pick the method that fits the objective. For price acceptance, start with Van Westendorp. For expected demand at a given price, use Gabor-Granger. If the question is which configuration to build and sell, conjoint testing is the better fit. Many teams combine two methods, using Van Westendorp to narrow the range and one of the others to decide within it.
Best practices for more reliable Van Westendorp research
Recruit people who actually buy in the category, and give every respondent the same product context.
Screen out inconsistent answer sequences, such as a bargain price higher than an expensive price, before building curves.
Segment results where it matters: by customer type, market, product tier or usage level. One blended curve can hide two very different buyer groups.
Report the full range and the curve chart, not just the OPP. Decision makers need the whole picture.
Keep the survey neutral. Don't show a reference price or a discount frame before the four questions.
Most modern consumer research platforms support open numeric inputs, logic checks and segment filters. The main question is whether yours also shows how respondents react to the offer, not only what they type.
Combining Van Westendorp with behavioral research
Van Westendorp tells you where prices feel acceptable. It doesn't tell you what people will do when they reach the shelf or the checkout page. That gap is real and measurable. In one survey reported in Harvard Business Review, 65% of consumers said they wanted to buy purpose-driven, sustainable brands, yet only about 26% actually did.
The fix is to treat the price range as a hypothesis and test it against evidence closer to real behavior. Add purchase likelihood questions at candidate prices, as the Newton-Miller-Smith extension does. Better still, observe how people react to the whole offer at those prices.
Perceived value depends on the whole offer, not only the number on the tag. Kantar's research found that brand-driven shoppers paid 38% more for brands they saw as meaningfully different, and even price-driven shoppers paid 14% more. If the value proposition is weak, the acceptable price range shrinks, so the story around the price needs testing too.
One practical approach is to follow a Van Westendorp study with short conversational interviews. Probing "why does $7 feel expensive?" often uncovers the anchors respondents are using, which is where AI moderated interviews and surveys serve different purposes.
Messaging matters just as much. Creative testing on claims, ads and value statements can show whether the product's story supports a price near the top of the range or pulls it toward the bottom.
Behavioral measurement adds a layer that surveys can't capture. Facial emotion AI picks up unfiltered reactions as people see a price or concept for the first time, before they rationalize an answer.
Attention data does something similar for the visual offer. Eye gaze tracking shows whether shoppers notice the price, the claim or the pack size, and in what order.
For physical products, the pack itself sets price expectations. Running package testing alongside pricing research helps confirm that the design signals the tier you plan to charge for.
Keep every round of findings together. A shared research repository lets the next pricing study build on earlier curves, interview notes and behavioral data instead of starting over.
Turning price perception into a pricing decision
Van Westendorp pricing is a quick, reliable way to find the limits buyers place on price. It will not choose your final price for you, and it was never designed to. Use it to narrow the field, then test the remaining candidates against demand, competition and real reactions.
Decode links stated pricing research with behavioral evidence. It offers 90%+ facial coding accuracy, 96% eye tracking accuracy, coverage of 62 facial expressions, support for 70+ languages and 17 patents, and is trusted by 150+ global brands. Teams use it to see how consumers respond to concepts, messaging and value propositions, and to run price testing against those reactions.
Frequently asked questions
1. What is the Van Westendorp pricing method?
It is a survey-based pricing research technique that asks respondents four questions about when a product feels too cheap, cheap, expensive and too expensive. The answers are plotted as cumulative curves to find an acceptable price range and four reference price points.
2. What are the four Van Westendorp pricing questions?
They ask at what price the product would be so cheap that quality is doubtful, a bargain, starting to feel expensive but still worth considering, and so expensive that the respondent would not buy it.
3. How do you calculate the optimal price point in Van Westendorp analysis?
Plot the cumulative "too cheap" curve (falling as price rises) and the cumulative "too expensive" curve (rising as price rises). The optimal price point is where the two curves cross.
4. What is the acceptable price range in the Van Westendorp Price Sensitivity Meter?
It is the band between the point of marginal cheapness and the point of marginal expensiveness. Prices inside it are broadly accepted. Prices outside it face rising rejection for being either too cheap or too expensive.
5. What is the difference between the optimal price point and the indifference price point?
The OPP balances the "too cheap" and "too expensive" extremes. The IPP balances the milder "cheap" and "expensive" perceptions and is often read as the market's normal or expected price.
6. How is Van Westendorp different from Gabor-Granger pricing?
Van Westendorp measures price perception and acceptable limits. Gabor-Granger asks how likely people are to buy at specific prices, which produces a demand curve and a revenue-maximizing estimate.
7. Does Van Westendorp measure willingness to pay?
Only indirectly. It captures stated perceptions of price thresholds, not actual purchase behavior. Hypothetical answers tend to overstate what people will really pay.
8. What are the limitations of the Van Westendorp pricing model?
It relies on stated rather than observed behavior, leaves out competitor prices and feature trade-offs, does not estimate demand or elasticity, and depends on respondents understanding the offer well