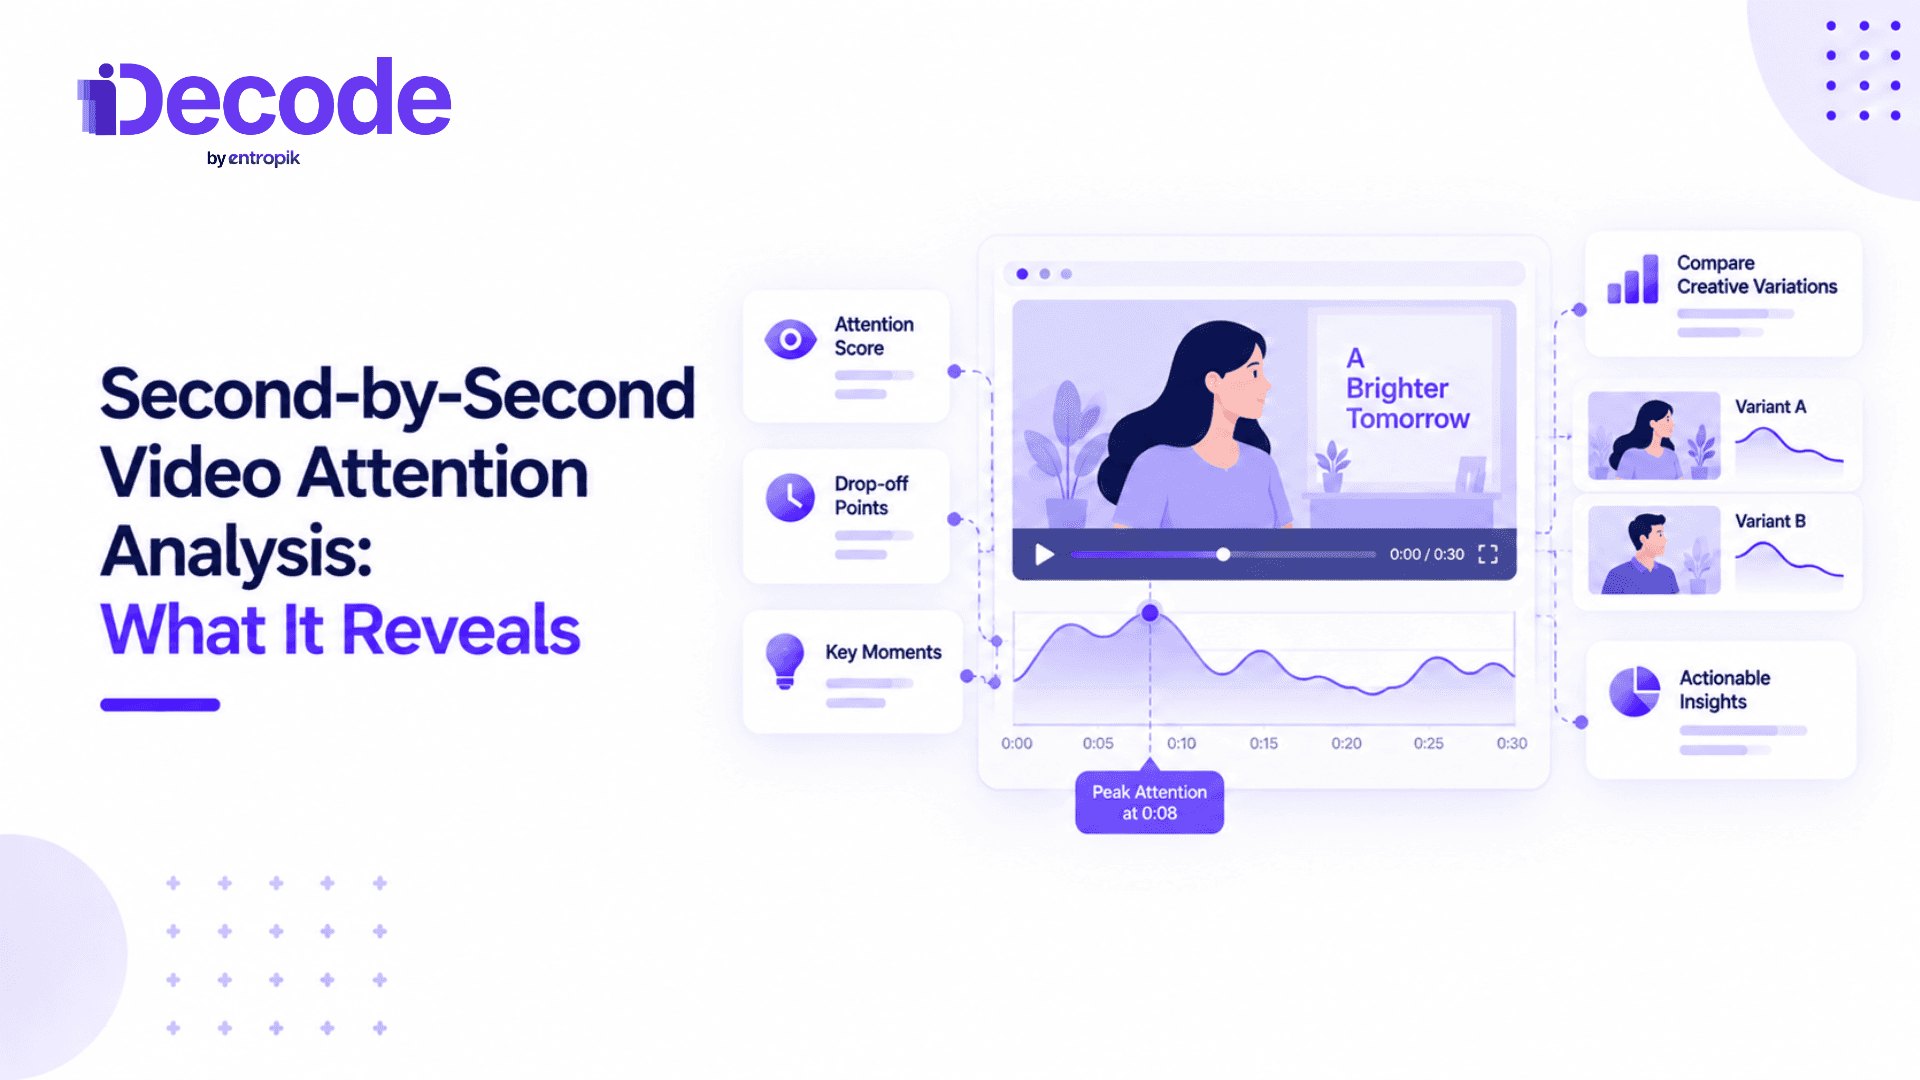
Second-by-second video attention analysis measures viewer engagement at each moment of a video rather than as a single overall score. It typically combines eye tracking, facial coding, or platform retention data to produce an attention curve that shows exactly where viewers stay engaged, where attention drops off, and which moments get rewatched.
Summary:
|
Most video reports end with a single number. A completion rate, an average view duration, an overall score. Those numbers tell you whether a video worked, but rarely why. When a video underperforms, teams are left guessing which scene, line, or edit lost the audience.
Second-by-second video attention analysis closes that gap. Instead of summarizing a video as one figure, it maps engagement across the full timeline so you can point to the exact moment viewers drifted, and the moment they leaned in.
This guide explains what the method is, how it differs from platform retention data, which techniques produce the curve, and how to turn what you find into better edits.
What Second-by-Second Video Attention Analysis Means
Second-by-second video attention analysis measures viewer engagement at each moment of a video rather than as one overall score. It typically combines eye tracking, facial coding, or platform retention data to show where viewers stay engaged, where attention falls away, and which moments hold them.
The output is usually an attention curve video teams can read at a glance: a line or graph plotting attention, emotion, or retention against time. Peaks show moments that hold people. Dips show moments that lose them.
The method applies in two settings:
Published video performance, where teams review how a live video held its audience
Pre-launch creative testing, where teams evaluate a cut before it goes into paid media
It sits naturally within broader ad testing, adding a timeline view to questions that are usually answered with a single score.
Why Frame-Level Data Matters More Than a Single Score
Video is now one of the largest lines in most media plans. The IAB projects US digital video ad spend will pass $80 billion in 2026. At that scale, knowing only that a video "underperformed" is an expensive blind spot.
Averages Hide the Problem
A video can hold a high completion rate while attention or comprehension quietly collapses in the middle. Viewers may keep playing while looking away, or stay on screen through a confusing section without taking in the message. The average looks healthy, and the weak moment stays hidden.
Single Metrics Cannot Locate the Cause
An aggregate score cannot tell you whether a slow opening, an unclear product shot, or a late brand reveal caused people to disengage. Frame-level engagement data can. It turns a vague sense that "the video didn't work" into a specific timestamp you can open, watch, and fix.
Timing Changes Results
When things happen in a video matters as much as what happens. Harvard Business School research tracked the eye movements of nearly 2,000 participants across 31 commercials and found that showing the brand in brief, repeated pulses reduced ad skipping compared with long brand shots at the start or end. That kind of insight is only visible when attention is measured moment by moment.
Getting the opening right has measurable value too. Kantar's validation of Google's ABCD framework, which starts with capturing attention early, found that ads following the guidelines were linked to a 30% lift in short-term sales likelihood and a 17% lift in long-term brand contribution. Frame-level data is how teams check whether their opening actually earns that attention.
It also underpins creative effectiveness more broadly, since a video can only persuade in the moments people are paying attention.
Second-by-Second Attention Analysis vs Platform Retention Curves
Biometric attention analysis | Platform retention curves | |
Data source | Eye tracking or facial coding in controlled viewing sessions | Aggregate view data from YouTube Studio, TikTok Analytics, and similar tools |
When available | Before launch | After the video is published |
Sample needed | Smaller, recruited panel | Large view counts |
What it shows | Where people look and how they feel at each moment | When people stop playing the video |
Best for | Diagnosing why engagement changes | Tracking real-world viewer retention timeline |
Both methods produce a similar-looking curve, which is why they are often confused. The underlying data is fundamentally different. A platform retention curve only records whether the video kept playing. A biometric curve records whether people were actually looking and how they were reacting.
Timing matters as well. Platform curves require the video to be live and viewed at scale, so any problems are discovered after budget is already spent. Biometric analysis can run on a smaller sample before launch, when fixes are still cheap.
Methods for Measuring Second-by-Second Attention
The right method depends on whether the video is already live or still being tested. Most mature programs combine at least two.
Eye Tracking and Gaze-Based Attention
Eye tracking records where viewers look moment to moment throughout a video, not just whether they kept watching. It reveals whether attention stayed on the product, the brand, the on-screen text, or drifted somewhere unintended.
This makes it the clearest way to pinpoint video drop-off points in visual attention, even when playback continues.
A primer on visual attention and eye gaze tracking covers the fundamentals.
This comparison of webcam and hardware eye tracking explains why remote studies are now practical at scale.
Gaze data is often visualized as heatmaps, a format many teams already know from website heatmap analysis. For video, those heatmaps are generated frame by frame.
Facial Coding and Emotional Response Curves
Facial coding tracks expressed emotion frame by frame, producing an emotional response curve alongside the attention curve. It helps explain why a drop-off happened, such as confusion, boredom, or disappointment, not just when.
The approach is well established in research. An MIT Media Lab study coded more than 12,000 facial responses from 1,223 people to 170 ads, covering 3.7 million frames. It found ad liking could be predicted from webcam facial responses, and that peak positive reactions immediately after a brand appearance were more likely to be effective.
For a practical overview of the technique, see this guide to facial coding in marketing.
Platform Retention Curves
Platform retention curves are aggregate, view-based graphs available in dashboards such as YouTube Studio and TikTok Analytics. They show the share of viewers still watching at each point in the video.
They are free and reflect real-world behavior, but they have two limits. The video must already be live, and it needs a meaningful view count before the curve is statistically reliable. They also cannot tell you whether a still-playing video had anyone's attention.
How to Read an Attention Curve
A curve is only useful if you know what its shapes mean.
The opening slope - The first ten to fifteen seconds usually show the steepest decline across most video content. A sharp fall here points to a weak hook or a slow start.
Sudden drops - An abrupt dip mid-video usually signals a pacing, clarity, or payoff problem at that exact moment, such as a confusing cut, dense copy, or a scene that runs too long.
Gradual decline - A slow, steady fade is normal. It becomes a concern only when it is steeper than similar videos in the same format.
Rewatch spikes - A rise in platform data often means viewers replayed a segment. Treat it as a moment worth studying, not automatically a problem to fix. It may be a highlight, or it may be a point of confusion.
Emotional peaks - High emotional response aligned with brand moments is a strong positive signal.
The placement of entertainment matters too. A separate MIT Media Lab field study of 82 ads and 178 consumers found that entertainment appearing after the brand was positively associated with purchase intent, while entertainment before the brand was not. Reading the emotional curve against brand appearances helps teams spot exactly this pattern.
Clear communication at each moment matters as well. When attention holds but comprehension slips, message testing can confirm what viewers actually took away.
How to Use Second-by-Second Data to Improve a Video
A simple three-step process turns frame-level engagement data into better edits.
Step 1: Find the sharpest drop-off.
Locate the steepest dip on the curve and note the timestamp. Then watch that exact moment in the video, along with a few seconds on either side.
Step 2: Diagnose the likely cause.
Common culprits include a slow open, a confusing cut, a delayed payoff, a brand reveal that interrupts the story, or on-screen text that competes with the visuals. Check the emotion curve to see whether viewers looked confused, bored, or simply distracted.
Step 3: Re-edit or re-test the specific segment.
Fix the moment rather than reworking the whole video. Tightening one scene, moving a product shot, or shortening a line is faster and cheaper than a full re-cut. Teams on tight budgets can follow these low-cost creative tests to validate the change.
AI creative testing can speed up this loop by scoring several edits before a full study is fielded.
For a closer look at how AI supports the workflow, see this guide to AI creative testing for ad performance.
Common Mistakes in Interpreting Attention Curves
Reading a drop without watching the footage. A timestamp tells you where the problem is, not what it is. Always review the actual moment before deciding on a fix.
Relying on completion rate instead of the full curve. Completion hides the shape of engagement. Two videos with the same completion rate can have very different curves.
Comparing curves across very different formats. A 6-second vertical ad and a 60-second film follow different patterns. Normalize for length and format before comparing.
Using too small a sample. For stable gaze heatmaps, Nielsen Norman Group recommends around 39 participants. Smaller samples can produce curves that shift with a few individuals.
Treating every spike as good. A rewatch spike can reflect confusion as easily as delight. Check emotion data before celebrating.
When evaluating ad creative testing platforms for this work, look for tools that output time-coded attention and emotion curves, not just summary scores.
Applying Frame-Level Attention Data Before a Video Ad Launches
Finding a weak moment after launch means paying for impressions that were never going to land. Pre-launch analysis catches the same problem while it is still a quick edit.
Decode's eye gaze tracking produces a second-by-second view of where viewers look throughout a video ad, so teams can confirm that the product and brand hold attention at the moments that matter.
The research behind the approach is covered in Decode's eye tracking whitepaper.
Facial emotion AI adds an emotional response curve on the same timeline. When attention dips, the emotion data shows whether viewers were confused, bored, or disengaged, which points directly to the right fix.
Attention measurement brings these signals together into a single engagement curve. Teams can spot the exact second a cut loses people, re-edit that segment, and re-test before the video goes into paid media.
This is especially useful for short-form work, where Decode's social media testing applies the same frame-level view to vertical video.
It applies equally to high-stakes spots, as seen in Decode's analysis of Super Bowl 2026 commercial teasers.
The same approach produced Decode's ranking of the most emotionally powerful Super Bowl ads of 2026.
It works for trailers too, as shown in these Kung Fu Panda 4 trailer insights.
With these signals in one creative insights platform, frame-level analysis becomes a routine pre-launch step rather than a post-mortem.
Frequently Asked Questions
1. What is the difference between a retention curve and an attention curve?
A retention curve shows how many viewers are still playing a video at each moment. An attention curve shows whether viewers are actually looking and engaged. A video can keep playing while attention drops.
2. Can you get second-by-second attention data before a video is published?
Yes. Eye tracking and facial coding can be run on a recruited panel using a rough cut or final edit, well before any media is bought.
3. What causes a sharp drop-off in the first few seconds of a video?
Usually a slow or unclear opening, a static first frame, a long logo sequence, or a hook that does not match what viewers expected.
4. What does a rewatch spike in an engagement graph mean?
It means viewers replayed that segment. It may be a highlight worth repeating in future work, or a confusing moment people went back to understand.
5. How many viewers or participants do you need for reliable attention curve data?
For gaze-based heatmaps, around 39 participants is a common guideline. Platform retention curves need far larger view counts to stabilize.
6. Is eye tracking or facial coding more useful for diagnosing video drop-off?
They answer different questions. Eye tracking shows where attention went, while facial coding shows how viewers felt. Using both gives the clearest diagnosis.
7. How is frame-level attention analysis used in video ad testing?
Teams use it to find the exact moments a video ad loses viewers, fix those segments, and confirm the edit works before the ad goes into paid media.
Pinpoint the Moment, Not Just the Outcome
Knowing that a video lost viewers is useful. Knowing the exact second it happened, and why, is what makes the video better. Second-by-second analysis replaces guesswork with specific, fixable moments, and running it before launch means those fixes happen before budget is spent.
Decode by Entropik applies eye gaze tracking and facial emotion AI to frame-level video attention analysis, so teams see exactly where a video holds or loses its audience. Explore Decode's approach to video creative testing.