Core usability metrics include task success rate, time on task, error rate, and the System Usability Scale (SUS), a short standardized questionnaire for perceived usability. No single metric tells the full story, so teams combine several signals, prioritizing based on whether the goal is reducing friction, comparing design versions, or monitoring ongoing experience quality.

Usability is not something teams should judge only by instinct. A design may feel clean, but that does not always mean users can complete tasks easily, understand what to do next, or move through a flow with confidence. If teams want to improve usability consistently, they need ways to measure it.
That is where usability metrics come in. They help teams move beyond opinion and understand how well an experience actually works. The right metrics can show whether users succeed, where they struggle, how efficiently they complete tasks, and whether the overall experience feels usable enough to support better product decisions.
What are usability metrics?
Usability metrics are the measures teams use to understand how effectively, efficiently, and clearly users can complete tasks in a product or interface.
At a practical level, a usability metric helps answer questions like:
Can users complete the task?
How long does it take?
Where do they make mistakes?
How difficult does the experience feel?
How usable does the product feel overall?
That is what makes usability metrics different from broader product metrics. Product metrics may focus on retention, conversion, engagement, or revenue. Usability metrics are more focused on whether the product experience itself is clear, smooth, and usable.
In other words, they help teams assess experience quality more directly.
Why usability metrics matter
Usability should be measured, not assumed. Without measurement, teams often rely too heavily on internal opinion, isolated feedback, or surface-level impressions.
Usability metrics matter because they help teams:
move beyond instinct
identify where friction exists
compare experiences more clearly
track improvement over time
support better design and product decisions
They also make usability testing more useful. Instead of just saying a flow “seems confusing,” teams can measure what is actually happening and use that evidence to prioritize changes.
The goal is not to reduce UX to numbers alone. The goal is to use metrics as signals that help teams interpret how the experience is performing.
The key usability metrics every UX team should track
There is no single metric that tells the full story. The best usability measurement usually combines a few signals, each showing a different part of the experience.
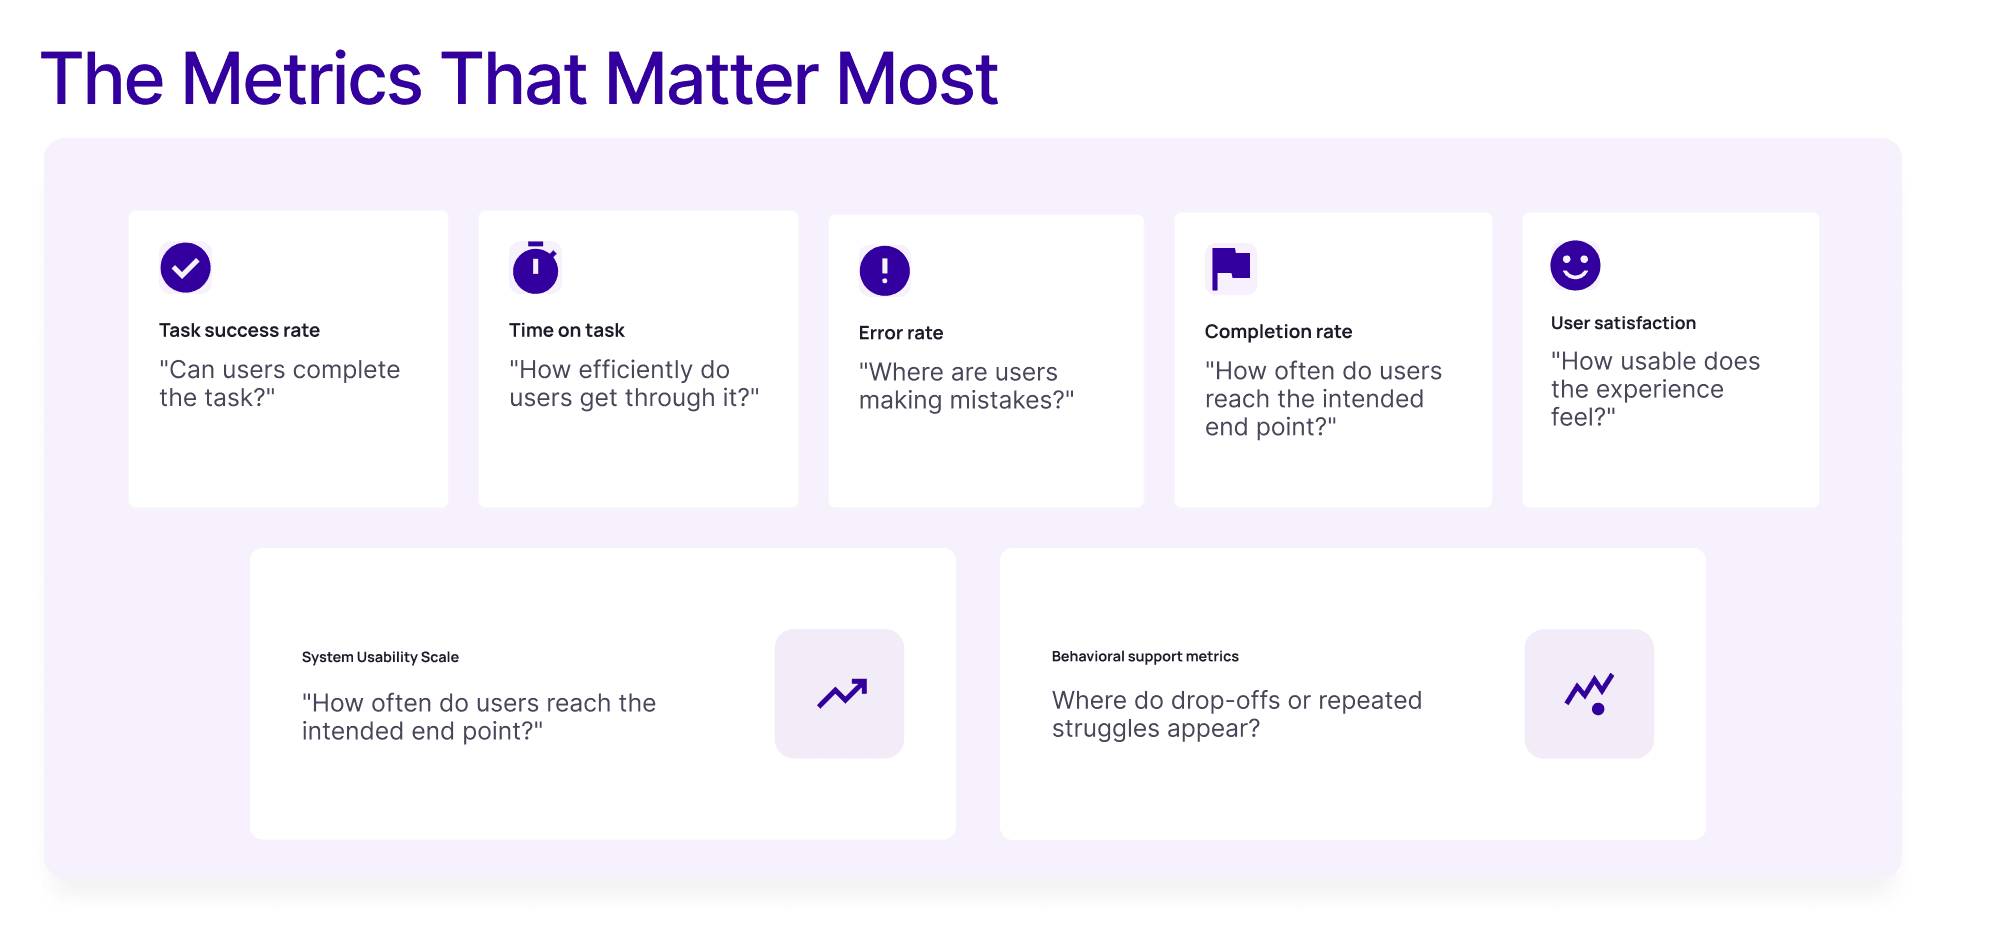
Task success rate
Task success rate measures whether users can complete a given task successfully.
This is one of the most important usability metrics because it gets to the heart of usability: can people do what they came to do?
Why it matters:
A design cannot be considered usable if users repeatedly fail to complete key tasks.
When to use it:
moderated usability testing
unmoderated task-based testing
critical user flows
onboarding, checkout, sign-up, search, and navigation tasks
How to interpret it:
A higher success rate usually points to a clearer and more usable experience. A lower one signals friction, confusion, or breakdowns in the flow.
Time on task
Time on task measures how long users take to complete a task.
It helps teams understand efficiency. A task may be technically completable, but still take too long because the path is unclear or the interface creates unnecessary effort.
Why it matters:
Usability is not only about completion. It is also about how smoothly users can get there.
When to use it:
when speed matters
when comparing design iterations
when validating streamlined task flows
How to interpret it:
Shorter is not always better. Sometimes users may move quickly because they are skipping details or misunderstanding the task. Time-on-task should be read alongside success rate and error rate.
Error rate
Error rate tracks how often users make mistakes during a task.
This can include:
clicking the wrong thing
taking a wrong path
entering invalid information
needing to backtrack
misunderstanding instructions
Why it matters:
High error rates often point to unclear labels, weak hierarchy, poor navigation, or confusing interaction design.
When to use it:
in task-based usability tests
when comparing versions of a flow
when diagnosing friction in forms, navigation, or critical workflows
How to interpret it:
A lower error rate generally means the experience is easier to understand and use.
Completion rate
Completion rate is closely related to task success, but can be useful when teams define task outcomes in slightly different ways.
For example, some teams separate:
full success
partial success
failure
In those cases, completion rate helps capture whether users reached the intended endpoint even if the path was imperfect.
Why it matters:
It gives teams a more structured way to evaluate success across multiple tasks.
When to use it:
usability testing with multiple tasks
benchmark studies
comparisons across versions or cohorts
How to interpret it:
A higher completion rate usually signals that the flow is easier to finish successfully. A lower completion rate suggests that users may be encountering friction, confusion, or barriers that prevent them from reaching the intended outcome.
User satisfaction
User satisfaction helps capture how users feel about the experience.
This can come from:
post-task ratings
ease-of-use questions
confidence ratings
satisfaction surveys
Why it matters:
A task can be completed successfully and still feel frustrating. Satisfaction helps reveal how usable the experience feels from the user’s point of view.
When to use it:
alongside task performance metrics
after key flows
when comparing overall experience quality
How to interpret it:
Higher satisfaction scores usually indicate that the experience felt clearer, smoother, or less frustrating. Lower satisfaction scores suggest that even if users completed the task, the experience may still have felt effortful, confusing, or unpleasant.
System Usability Scale
The System Usability Scale is one of the best-known standardized usability measures.
It is a short questionnaire used to capture perceived usability through a structured scoring system. Teams often use it when they want a fast, repeatable way to compare perceived usability across versions, products, or time periods.
Why it matters:
It gives teams a standard way to quantify perceived usability, especially when they want more than open-ended feedback.
When to use it:
benchmark studies
comparing design versions
tracking perceived usability over time
adding a standardized satisfaction/usability layer to testing
How to interpret it:
It works best as one input among several. It should support other usability metrics, not replace them.
Engagement or behavioral support metrics
Depending on the product, teams may also look at broader behavioral signals such as:
drop-off points
repeated interactions
abandonment during tasks
return actions
support-seeking behavior
These are not always pure usability metrics, but they can help teams understand where usability issues may be affecting behavior.
How to measure usability in practice
Knowing which metrics matter is only part of the picture. Teams also need to understand how to measure usability in a useful way.
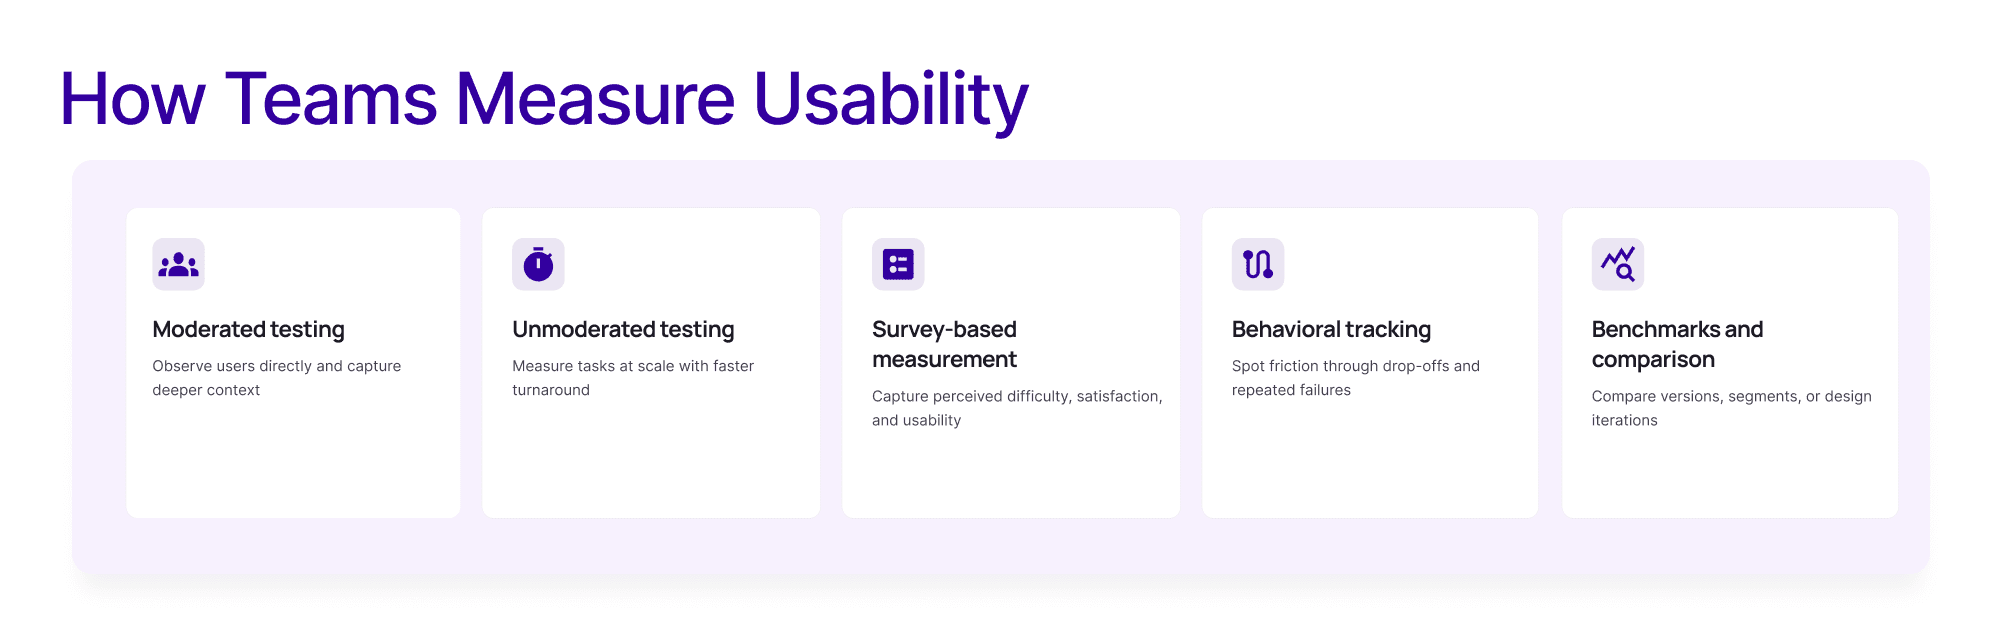
Moderated usability testing
This is one of the most common ways to collect usability testing metrics. Researchers can observe behavior directly, capture task success, time on task, and error patterns, and also ask follow-up questions.
This is especially useful when teams need:
direct observation
deeper context
clarity on why users struggled
Unmoderated usability testing
Unmoderated testing is useful when teams want scale and faster turnaround. It can still support usability test metrics such as completion, time on task, and satisfaction ratings.
This is often useful when:
tasks are clearly defined
scale matters
teams need quicker directional input
Survey-based usability measurement
Post-task and post-study surveys help measure perceived difficulty, satisfaction, and usability. This is where standardized measures like System Usability Scale can fit in well.
Behavioral tracking and usability analytics
Usability analytics can support usability measurement by showing:
drop-offs
repeated failed interactions
abandonment patterns
friction points in live flows
This helps teams understand usability issues at scale, especially after launch.
Benchmarks and comparison
The most useful measurement often comes from comparison:
one flow vs another
one version vs another
before redesign vs after redesign
one segment vs another
In practice, teams should avoid relying on only one metric. Usability becomes much easier to understand when multiple signals work together.
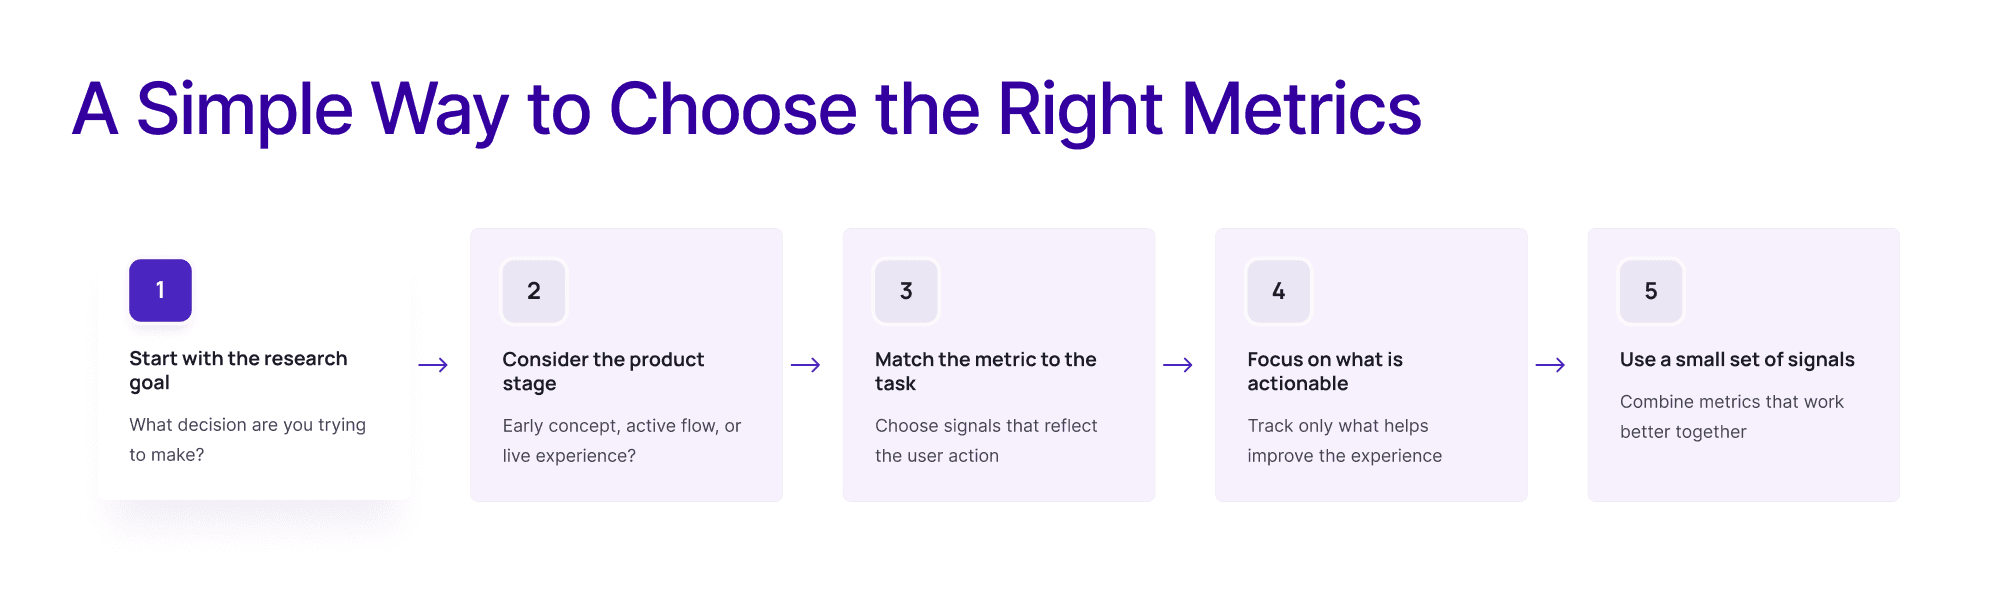
How teams should choose which usability metrics to track
Not every project needs every metric.
The best metrics depend on:
the research goal
the product stage
the type of task
the decision that needs to be made
the level of confidence needed
For example:
if the goal is to reduce friction in a task flow, focus on task success, time on task, and error rate
if the goal is to compare versions, add structured measures like SUS
if the goal is to monitor live experience quality, combine usability metrics with behavioral support signals
if the flow is early-stage, lighter directional measurement may be enough
The key is to choose metrics that are actionable. Teams do not need a long list just because they can measure it. They need a small set of signals that help them decide what to improve.
Common mistakes when using usability metrics
Usability metrics are useful, but only if teams use them carefully.
Common mistakes include:
Tracking too many metrics
More numbers do not automatically mean better understanding. Too many metrics can dilute focus.
Focusing on one metric in isolation
A single number rarely tells the whole story. Task success, speed, error rate, and satisfaction often need to be interpreted together.
Measuring without context
A time-on-task number means little without task complexity, user type, or comparison context.
Using metrics without benchmarks
Metrics become more useful when teams compare them against:
previous versions
target thresholds
baseline usability testing
related task benchmarks
Treating usability metrics as the whole story
Usability metrics are one part of the picture. They work best when combined with qualitative insight, observation, and product context.
Final thoughts
Usability metrics help teams make better design and product decisions because they turn usability from a vague impression into something measurable.
The most useful approach is not to track every possible metric. It is to choose the metrics that best match the task, the product stage, and the decision in front of the team.
When interpreted in context, usability metrics can help teams identify friction earlier, compare experiences more clearly, and improve products with more confidence.
FAQs
What are usability metrics?
Usability metrics are measures teams use to understand how effectively, efficiently, and clearly users can complete tasks in a product or interface.
Which usability metrics should UX teams track?
Common metrics include task success rate, time on task, error rate, completion rate, user satisfaction, and System Usability Scale.
How do you measure usability?
Teams can measure usability through moderated testing, unmoderated testing, survey-based measurement, behavioral tracking, and benchmark comparisons.
When should teams use System Usability Scale?
System Usability Scale is useful when teams want a fast, repeatable way to measure perceived usability and compare products, flows, or design versions over time.
What are the best usability testing metrics?
Some of the most useful usability testing metrics are task success rate, time on task, error rate, user satisfaction, and System Usability Scale.
See how teams can measure usability more clearly and turn findings into better product decisions.


