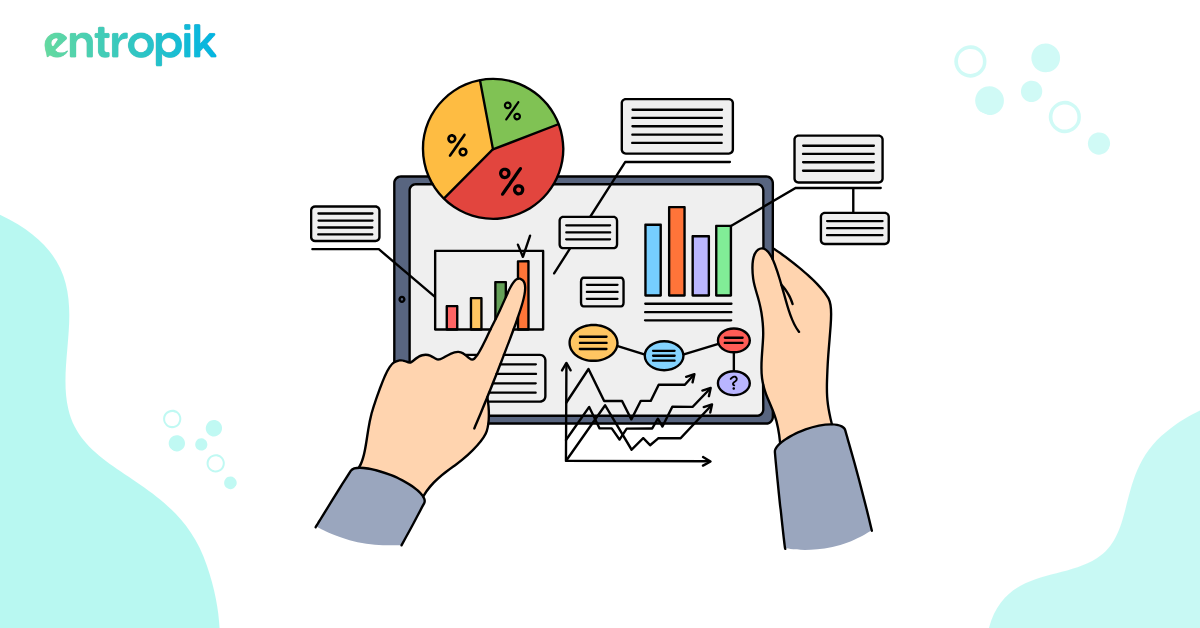
Quantitative data, which can be measured, is crucial for businesses to evaluate the performance of their products or departments.
Businesses analyze two types of quantitative data: discrete and continuous. Understanding the distinctions between these types helps in accurately gathering and interpreting information, aiding in better decision-making.
This blog will explain discrete and continuous data, provide examples, and discuss their differences.
What is Discrete Data?
Discrete Data Meaning
Discrete data refers to information that can only take on specific, distinct values. These values are countable and often represent whole numbers. Discrete data cannot be meaningfully subdivided into smaller parts, meaning there are no intermediate values between the distinct points. This type of data is typically used when the data points are categorical or when the data involves counting objects or occurrences.
Real-Life Example of Discrete Data
Consider the example of a retail store counting the number of products sold each day. If the store sold 50 items on Monday, 45 items on Tuesday, and 60 items on Wednesday, these numbers represent discrete data. Each count is a whole number, and it doesn’t make sense to have fractional sales (like 45.5 items).
Discrete Data in Research
In research, discrete data often comes into play when counting occurrences or categorizing responses. For instance, imagine a survey conducted to study the number of books read by high school students in a month. The survey results might show that one student read 2 books, another read 5 books, and another read none. These counts are examples of discrete data, as they represent distinct whole numbers.
Research Example
Consider a psychological study investigating the frequency of a specific behavior among participants. Suppose researchers are examining how many times individuals check their smartphones in a day. Participants report their usage as follows:
Participant A: 25 times
Participant B: 30 times
Participant C: 15 times
These numbers are discrete data points. They represent distinct counts of behavior and cannot be fractional. By analyzing this data, researchers can identify patterns, such as the average number of times participants check their smartphones daily, and conclude smartphone usage habits. This information can be crucial for understanding the impact of smartphone use on daily life and mental health.
What is Continuous Data?
Continuous Data Meaning
Continuous data refers to information that can take on any value within a given range. Unlike discrete data, continuous data can be subdivided into finer increments, with infinitely many possible values between any two points. This type of data often represents measurements and can include fractions and decimals.
Real-Life Example of Continuous Data
Consider the example of measuring the height of people in a population. Heights can vary greatly and can be measured with a high degree of precision. One person might be 170.2 cm tall, another 165.5 cm, and another 180.3 cm. These values are continuous because height can be measured to any level of detail, limited only by the precision of the measuring instrument.
Continuous Data in Consumer Research
In consumer research, continuous data is valuable for understanding detailed consumer behaviors and preferences, helping businesses make informed decisions about product development, marketing strategies, and customer service improvements.
Consumer Research Example
Imagine a consumer research team analyzing the amount of money customers spend on groceries each month. They collect data on the monthly grocery expenditures of a sample of customers. The recorded amounts might be:
- Customer A: $150.75
- Customer B: $200.50
- Customer C: $175.30
These expenditures represent continuous data because the amounts spent can take on any value within a range and can be measured precisely down to the cents. Unlike counting the number of purchases (which would be discrete data), measuring the amount spent allows for a more detailed and nuanced analysis.
By examining this continuous data, researchers can identify spending patterns, such as average monthly expenditures, variations across different customer demographics, and trends over time. This detailed information can help businesses understand consumer spending habits, tailor their marketing strategies, and optimize their pricing models. For example, if the data shows that a significant portion of customers spends less during certain months, the company might introduce promotions or discounts during those periods to boost sales.
Also Read - Demographic Survey Question Template
Difference Between Discrete and Continuous Data

Importance of Discrete and Continuous Data in Building Better Marketing and Product Experiences
Discrete Data
Discrete data is essential for marketing and product development because it provides clear, countable insights that can drive strategic decisions. Here are some key aspects:
Customer Segmentation
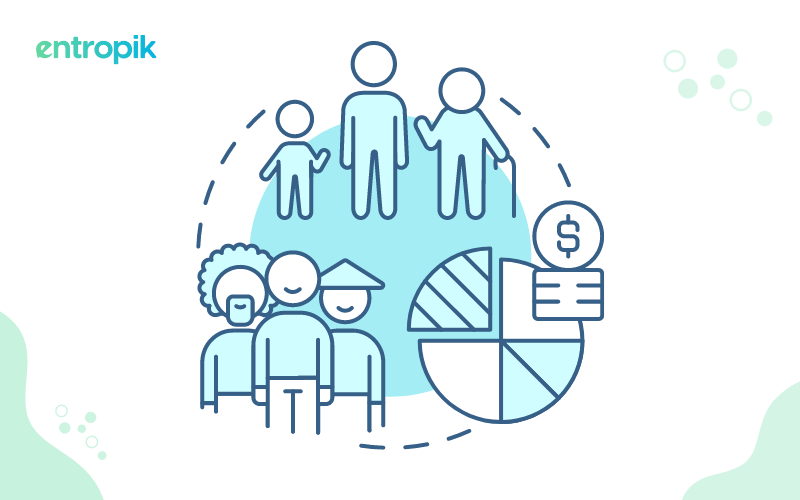
Discrete data helps in categorizing customers into distinct groups based on specific characteristics such as age, gender, purchase frequency, or product preferences. This segmentation allows for targeted marketing campaigns tailored to each group’s needs and behaviors.
Behavioral Analysis
By counting specific actions, such as the number of clicks on a particular ad or the number of times a feature is used, businesses can understand what aspects of their product or marketing strategy are most engaging to users.
Performance Metrics
Discrete data provides straightforward metrics such as the number of units sold, new users, or the frequency of certain actions. These metrics are crucial for evaluating the success of marketing campaigns and product features.
Customer Feedback
Survey responses and reviews often yield discrete data that can be quantified, such as ratings or yes/no answers. This data helps assess customer satisfaction and identify areas for improvement.
Continuous Data
Continuous data complements discrete data by offering detailed, measurable insights that can refine marketing and product strategies. Here are some key aspects:
Understanding Trends
Continuous data, such as the duration of time users spend on a website or app, helps in identifying usage patterns and trends. This information is critical for optimizing user experience and improving engagement.
Personalization
Continuous data allows for a more nuanced understanding of customer preferences and behaviors. For example, knowing the average spending of customers enables personalized offers and recommendations, enhancing customer satisfaction and loyalty.
Performance Optimization
Continuous data is vital for A/B testing and performance analysis. By measuring variables such as load times, conversion rates, or the effectiveness of different marketing messages, businesses can continuously improve their strategies and offerings.
Predictive Analytics
Continuous data supports advanced analytics techniques like predictive modeling. By analyzing trends and patterns in continuous data, businesses can forecast future behaviors and outcomes, allowing for proactive adjustments to marketing and product strategies.
See how Decode uses Predictive Eye Tracking to analyze consumer behavior
Integration of Discrete and Continuous Data
Integrating both discrete and continuous data provides a comprehensive view of customer behaviors and preferences. Here’s how their combined use enhances marketing and product experiences:
Holistic Customer Insights
Discrete data offers categorical insights, while continuous data provides depth and detail. Together, they help businesses gain a full understanding of customer journeys, from general behaviors to specific interactions.
Enhanced Decision Making
The combination of both data types allows for more informed decisions. For example, knowing how often a product is purchased (discrete) and the average amount spent (continuous) enables more effective pricing and inventory strategies.
Balanced Performance Metrics
While discrete data gives clear performance indicators, continuous data offers context and depth. For example, knowing the number of app downloads (discrete) alongside the average session duration (continuous) provides a fuller picture of app engagement.
Targeted and Efficient Marketing
Discrete data helps identify target segments, and continuous data refines the approach by indicating the best times and channels to reach these segments. This leads to more efficient and impactful marketing campaigns.
Conclusion
Both discrete and continuous data are vital in building better marketing and product experiences. Discrete data offers clear, countable insights, while continuous data provides detailed, measurable information. Together, they enable businesses to understand their customers deeply, make informed decisions, and continuously improve their marketing strategies and product offerings.
Frequently Asked Questions
What is the difference between continuous and discrete data?
Discrete data consists of countable, distinct values like sales figures or student counts, visualized with bar or pie charts. Continuous data encompasses a range of values, such as height or temperature, depicted using histograms or line graphs, allowing for detailed measurements and analysis.
What is an example of discrete data?
Discrete data, like the number of students in different classes (e.g., 20 in Class A, 25 in Class B, 30 in Class C), consists of distinct, countable values represented by whole numbers. It's ideal for categorical variables or situations where data points are separate and cannot be divided further into smaller parts.
What is an example of continuous data?
Continuous data, such as student heights (e.g., 150.5 cm, 155.2 cm, 162.1 cm), varies within a range and includes fractional values, allowing for precise measurement. It's used in scientific and analytical contexts where data can be infinitely subdivided between any two points, essential for detailed analysis and decision-making in fields like physical characteristics and research.
{{cta-button}}


.jpg)


