Business intelligence (BI) tools gather, analyze, and visualize raw data into clear, actionable information, helping product teams identify trends and make data-driven decisions rather than relying solely on traditional surveys and focus groups. Companies like Spotify and Amazon use BI tools to track real-time user behavior, from listening habits to purchase patterns, informing everything from personalized recommendations to broader product strategy.

Understanding user needs and making data-driven decisions is important for any business aiming to stay competitive. Imagine a scenario where a product manager, is tasked with launching a new feature for a popular mobile app. The stakes are high, and the margin for error is slim. This is where business intelligence (BI) tools come into play, transforming how companies approach user research and product management.
What is Business Intelligence?
Business intelligence (BI) is essentially a set of tools and methods that businesses use to gather, store, analyze, and interpret their data. By turning raw data into clear information, BI helps companies identify trends, answer questions, and ultimately make better, data-driven decisions about everything from sales and marketing to operations and staffing.
The Power of Data
Traditionally, companies relied on surveys and focus groups to gather user feedback. While these methods provided some insights, they were often slow and sometimes biased. There had to be a better way to understand users and make informed decisions.
That's when business intelligence tools come into the picture. BI tools are software applications that collect, process, and analyze vast amounts of data to provide actionable insights. They can track user behavior, monitor market trends, and predict future patterns. For companies, this means accessing real-time data and making evidence-based decisions swiftly.
From Data to Insight: Real-Life Example
Consider Netflix, a company renowned for its use of BI tools. Netflix uses data analytics to understand users' viewing habits, preferences, and trends. This data-driven approach allows them to recommend shows and movies tailored to individual tastes, increasing user satisfaction and retention. By leveraging BI tools, Netflix ensures its content strategy aligns with user preferences.
Similarly, a mid-sized e-commerce company implemented a BI tool like Tableau. The company can now visualize data from various sources in one dashboard. They saw how users interacted with their website, which products were most popular, and where users abandoned their carts. This holistic view enabled them to identify pain points and opportunities for improvement.
Advantages of BI Tools
Enhancing User Research
One of the key benefits of BI tools in user research is their ability to provide a 360-degree view of the customer. For example, companies can use BI tools to segment users based on demographics, behavior, and preferences. This segmentation helps understand the different needs and motivations of each user group.
Spotify is another company that has successfully leveraged BI tools for user research. Spotify analyzes how users interact with their platform, what kind of music they prefer, and even what times they listen to music. This data helps Spotify curate personalized playlists and improve user experience.
For an e-commerce company, segmentation might reveal that younger users prefer more trendy products, while older users value practicality. These insights guide product development and marketing strategies, ensuring that the company caters to the diverse needs of its user base.
Driving Product Management
With the insights from BI tools, companies can make informed decisions throughout the product management lifecycle. From ideation to launch, every step is backed by data.
Amazon is a prime example. Amazon uses BI tools to track user behavior on their platform, from search queries to purchase patterns. This data helps them optimize their product listings, pricing strategies, and inventory management. They can predict which products will be in high demand and ensure they are well-stocked.
For the e-commerce company, predictive analytics forecasted how a new product feature would perform based on historical data. This helped set realistic goals and KPIs. During the development phase, they monitored user engagement and feedback in real-time, allowing quick adjustments and improvements.
Communicating Insights
Another critical aspect of using BI tools is their ability to communicate insights effectively. Companies can create interactive reports and dashboards that are easily understood and shared with their teams. This fosters a data-driven culture within the organization, where every team member can access the insights they need to make informed decisions.
Google, for instance, uses BI tools to create dashboards that track the performance of their products. These dashboards are accessible to all team members, ensuring everyone is aligned and informed. This transparency and accessibility of data help teams work more efficiently and collaboratively.
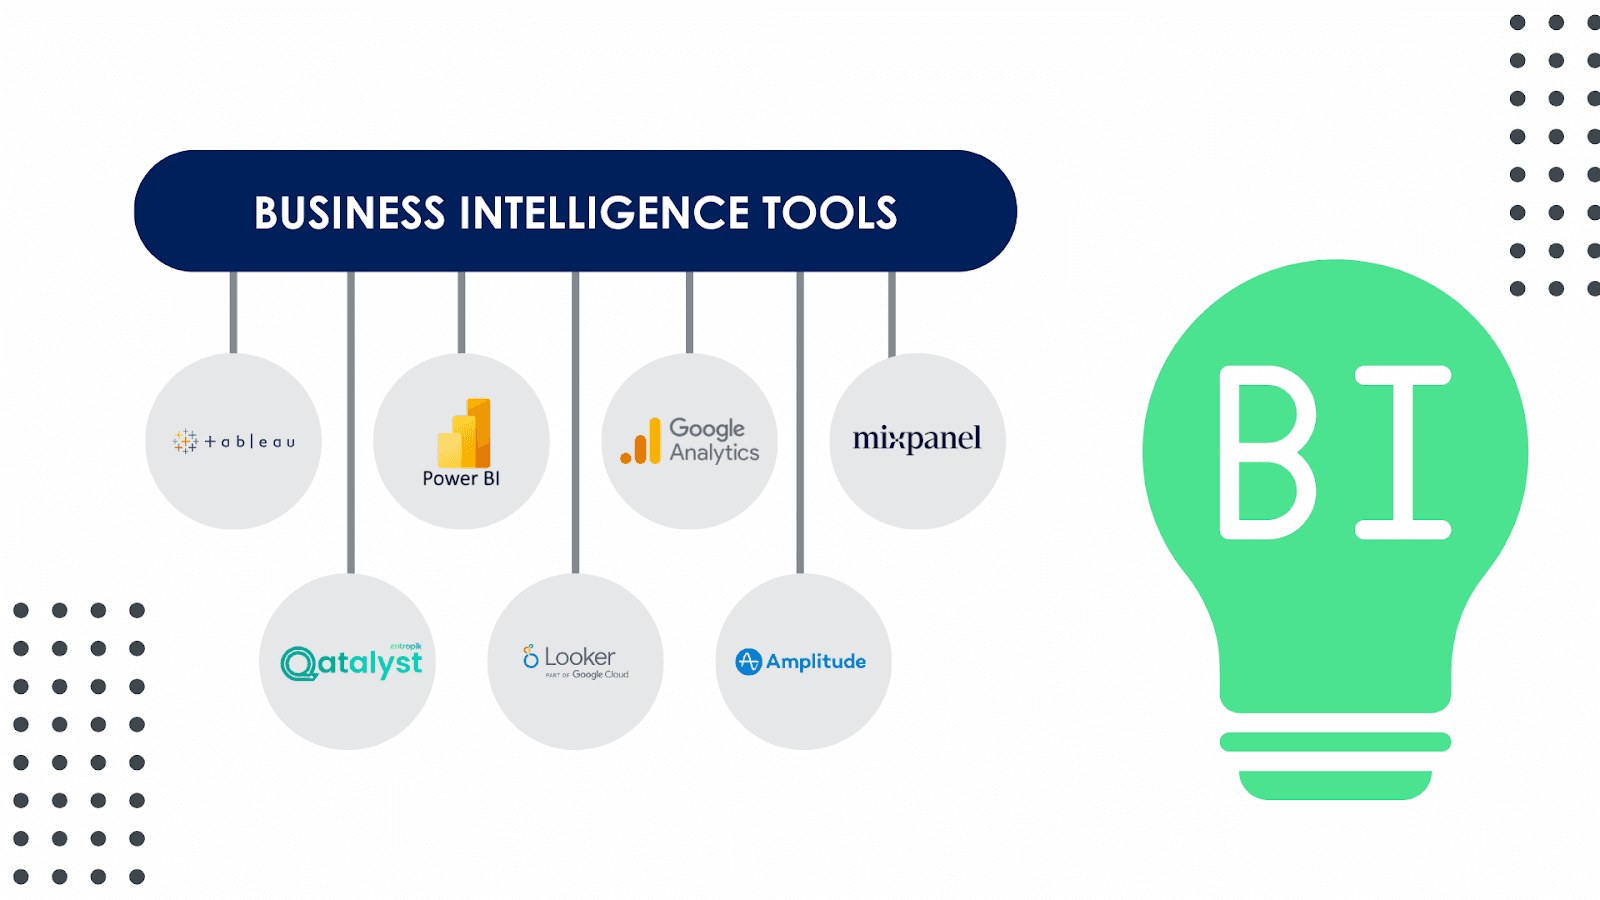
Top Business Intelligence Tools for User Research and Product Management
Business intelligence (BI) tools are essential for extracting, analyzing, and visualizing data to drive user research and product management decision-making processes. Here are some BI tools that stand out for their capabilities in these areas:
Tableau
Power BI
Google Analytics
Mixpanel
Qatalyst
Looker
Amplitude
Let's explore why these tools are beneficial with detailed explanations and examples.
1. Tableau
Why Use Tableau:
Data Visualization: Tableau excels in creating interactive and shareable dashboards. It transforms raw data into visual insights quickly and effectively.
Integration: It integrates with various data sources, including SQL databases, cloud apps, and spreadsheets.
User-Friendly: Its drag-and-drop interface makes it accessible to non-technical users.
Example: A retail company uses Tableau to analyze sales data and customer feedback. They identify trends such as peak shopping times and popular product categories by visualizing data. This helps in optimizing inventory management and marketing strategies.
2. Power BI
Why Use Power BI:
Comprehensive Reporting: Power BI offers robust reporting capabilities with detailed visuals and drill-down options.
Microsoft Integration: Seamlessly integrates with other Microsoft products like Excel, Azure, and SharePoint.
Real-Time Data: Provides real-time data access and updates, which is crucial for dynamic decision-making.
Example: A software company leverages Power BI to track user engagement metrics across its suite of products. The real-time data helps them quickly identify and address any drop-offs in user activity, improving user retention.
3. Google Analytics
Why Use Google Analytics:
Web and App Analytics: Provides detailed insights into user behavior on websites and mobile apps.
Traffic Analysis: Helps understand where traffic is coming from, what users are doing on the site, and how they are converting.
Free and Comprehensive: Offers a wide range of features at no cost, with advanced features available in the premium version.
Example: An e-commerce platform uses Google Analytics to track user journeys from landing pages to checkout. They identify that a high bounce rate on the product page correlates with slow load times, prompting them to optimize page performance.
4. Mixpanel
Why Use Mixpanel:
User Behavior Analytics: Focuses on tracking and analyzing specific user actions within applications.
Event-Based Tracking: Allows tracking of detailed user interactions, such as button clicks and feature usage.
Segmentation: Provides robust user segmentation and cohort analysis to understand user retention and behavior over time.
Example: A mobile app developer uses Mixpanel to monitor how users interact with a new feature. They discover that users are not utilizing a key functionality, leading to a redesign that improves user engagement and satisfaction.
5. Qatalyst
Why Use Qatalyst:
Integrated User Research: Qatalyst offers a comprehensive platform combining traditional user research with advanced AI capabilities.
Insights AI: Incorporates Emotion AI, Behavior AI, and Generative AI to provide deeper insights into user experiences.
Holistic Analysis: Tracks and analyzes both emotional responses and behavioral patterns to understand user motivations and pain points.
Example: A BFSI company utilizes Qatalyst to analyze user interactions with its app. By leveraging Emotion AI, they detect frustration during the user journey through user facial expressions and vocal tones. Behavior AI identifies specific steps where users drop off. Generative AI provides suggestions for improving the user experience. This multi-faceted analysis leads to a redesign that significantly enhances user satisfaction and retention.
{{cta-white}}
6. Looker
Why Use Looker:
Data Exploration: Offers powerful data exploration and visualization capabilities tailored for business users.
Custom Applications: Allows building custom data applications and embedding analytics into other tools.
Scalability: Scales easily with growing data needs and integrates well with the Google Cloud Platform.
Example: A subscription service company uses Looker to analyze customer data and predict churn rates. They create custom dashboards to monitor key metrics, enabling proactive customer retention strategies.
7. Amplitude
Why Use Amplitude:
Product Analytics: Focuses on deep product analytics to understand user behavior and product usage.
Behavioral Cohorts: Allows the creation of behavioral cohorts to analyze how different groups of users interact with the product over time.
Growth Metrics: Provides insights into metrics that drive growth, such as user retention, engagement, and lifetime value.
Example: A gaming company employs Amplitude to track player interactions and identify patterns leading to long-term engagement. They find that players who engage with social features within the first week are more likely to remain active, leading to targeted feature enhancements.
These business intelligence tools provide invaluable insights for user research and product management. By leveraging their capabilities, companies can make data-driven decisions, enhance user experiences, and optimize their products for better market performance. Each tool has unique strengths, and choosing the right one depends on specific business needs and goals.
The Results
The results are often remarkable. With successful BI tool implementation, user engagement can exceed expectations. Real-time data allows companies to monitor performance and make data-driven enhancements continuously. This leads to increased user satisfaction and retention, ultimately boosting revenue.
Conclusion
In conclusion, business intelligence tools are invaluable in user research and product management. They provide a deeper understanding of customer needs, enable data-driven decision-making, and foster a collaborative and informed organizational culture. By leveraging the power of BI tools, any company can unlock the full potential of its products. As the business landscape evolves, those who embrace these tools will be well-positioned to lead and innovate.
{{cta-trial}}
Frequently asked questions
1. What are business intelligence (BI) tools?
BI tools are software platforms that collect, analyze, and visualize business data, helping teams make data-driven decisions across sales, marketing, product, and research.
2. How do BI tools support user research?
BI tools can integrate quantitative usage and behavioral data with qualitative research findings, giving researchers a fuller, more data-backed picture of user behavior.
3. What is the connection between BI tools and product management?
Product managers use BI tools to track feature usage, adoption metrics, and customer behavior trends, informing prioritization and roadmap decisions.
4. Can BI tools replace dedicated user research platforms?
No, BI tools excel at quantitative data analysis, but dedicated research platforms remain essential for qualitative insight into the 'why' behind the data BI tools surface.
5. How can product and research teams collaborate using BI tools?
By connecting BI dashboards with research repositories, teams can cross-reference quantitative trends with qualitative context, creating a more complete view for decision-making.


