Affinity mapping, or affinity diagram, is a visual technique in which ideas or information are written on separate notes and grouped based on common themes or relationships. It helps organize and make sense of diverse information, revealing patterns and insights.
A comprehensive and coherent image emerges by gradually categorizing the information blocks, revealing underlying patterns and connections within your research data. This process helps make sense of complex data and enhances understanding of the larger picture.
This blog will help you uncover the concept of affinity mapping, guide you on how to do it yourself, and illustrate various ways you can utilize it to streamline and synthesize your UX research process.
What Is an Affinity Diagram?
An affinity diagram or map comes from affinity mapping, also known as the K-J method, which originated in the 1960s and was introduced by Japanese anthropologist Jiro Kawakita. It shows how different pieces of information are connected and put into groups.
You can determine the significance of each topic by counting the cards in each group. This helps in prioritizing and deciding what to focus on initially.
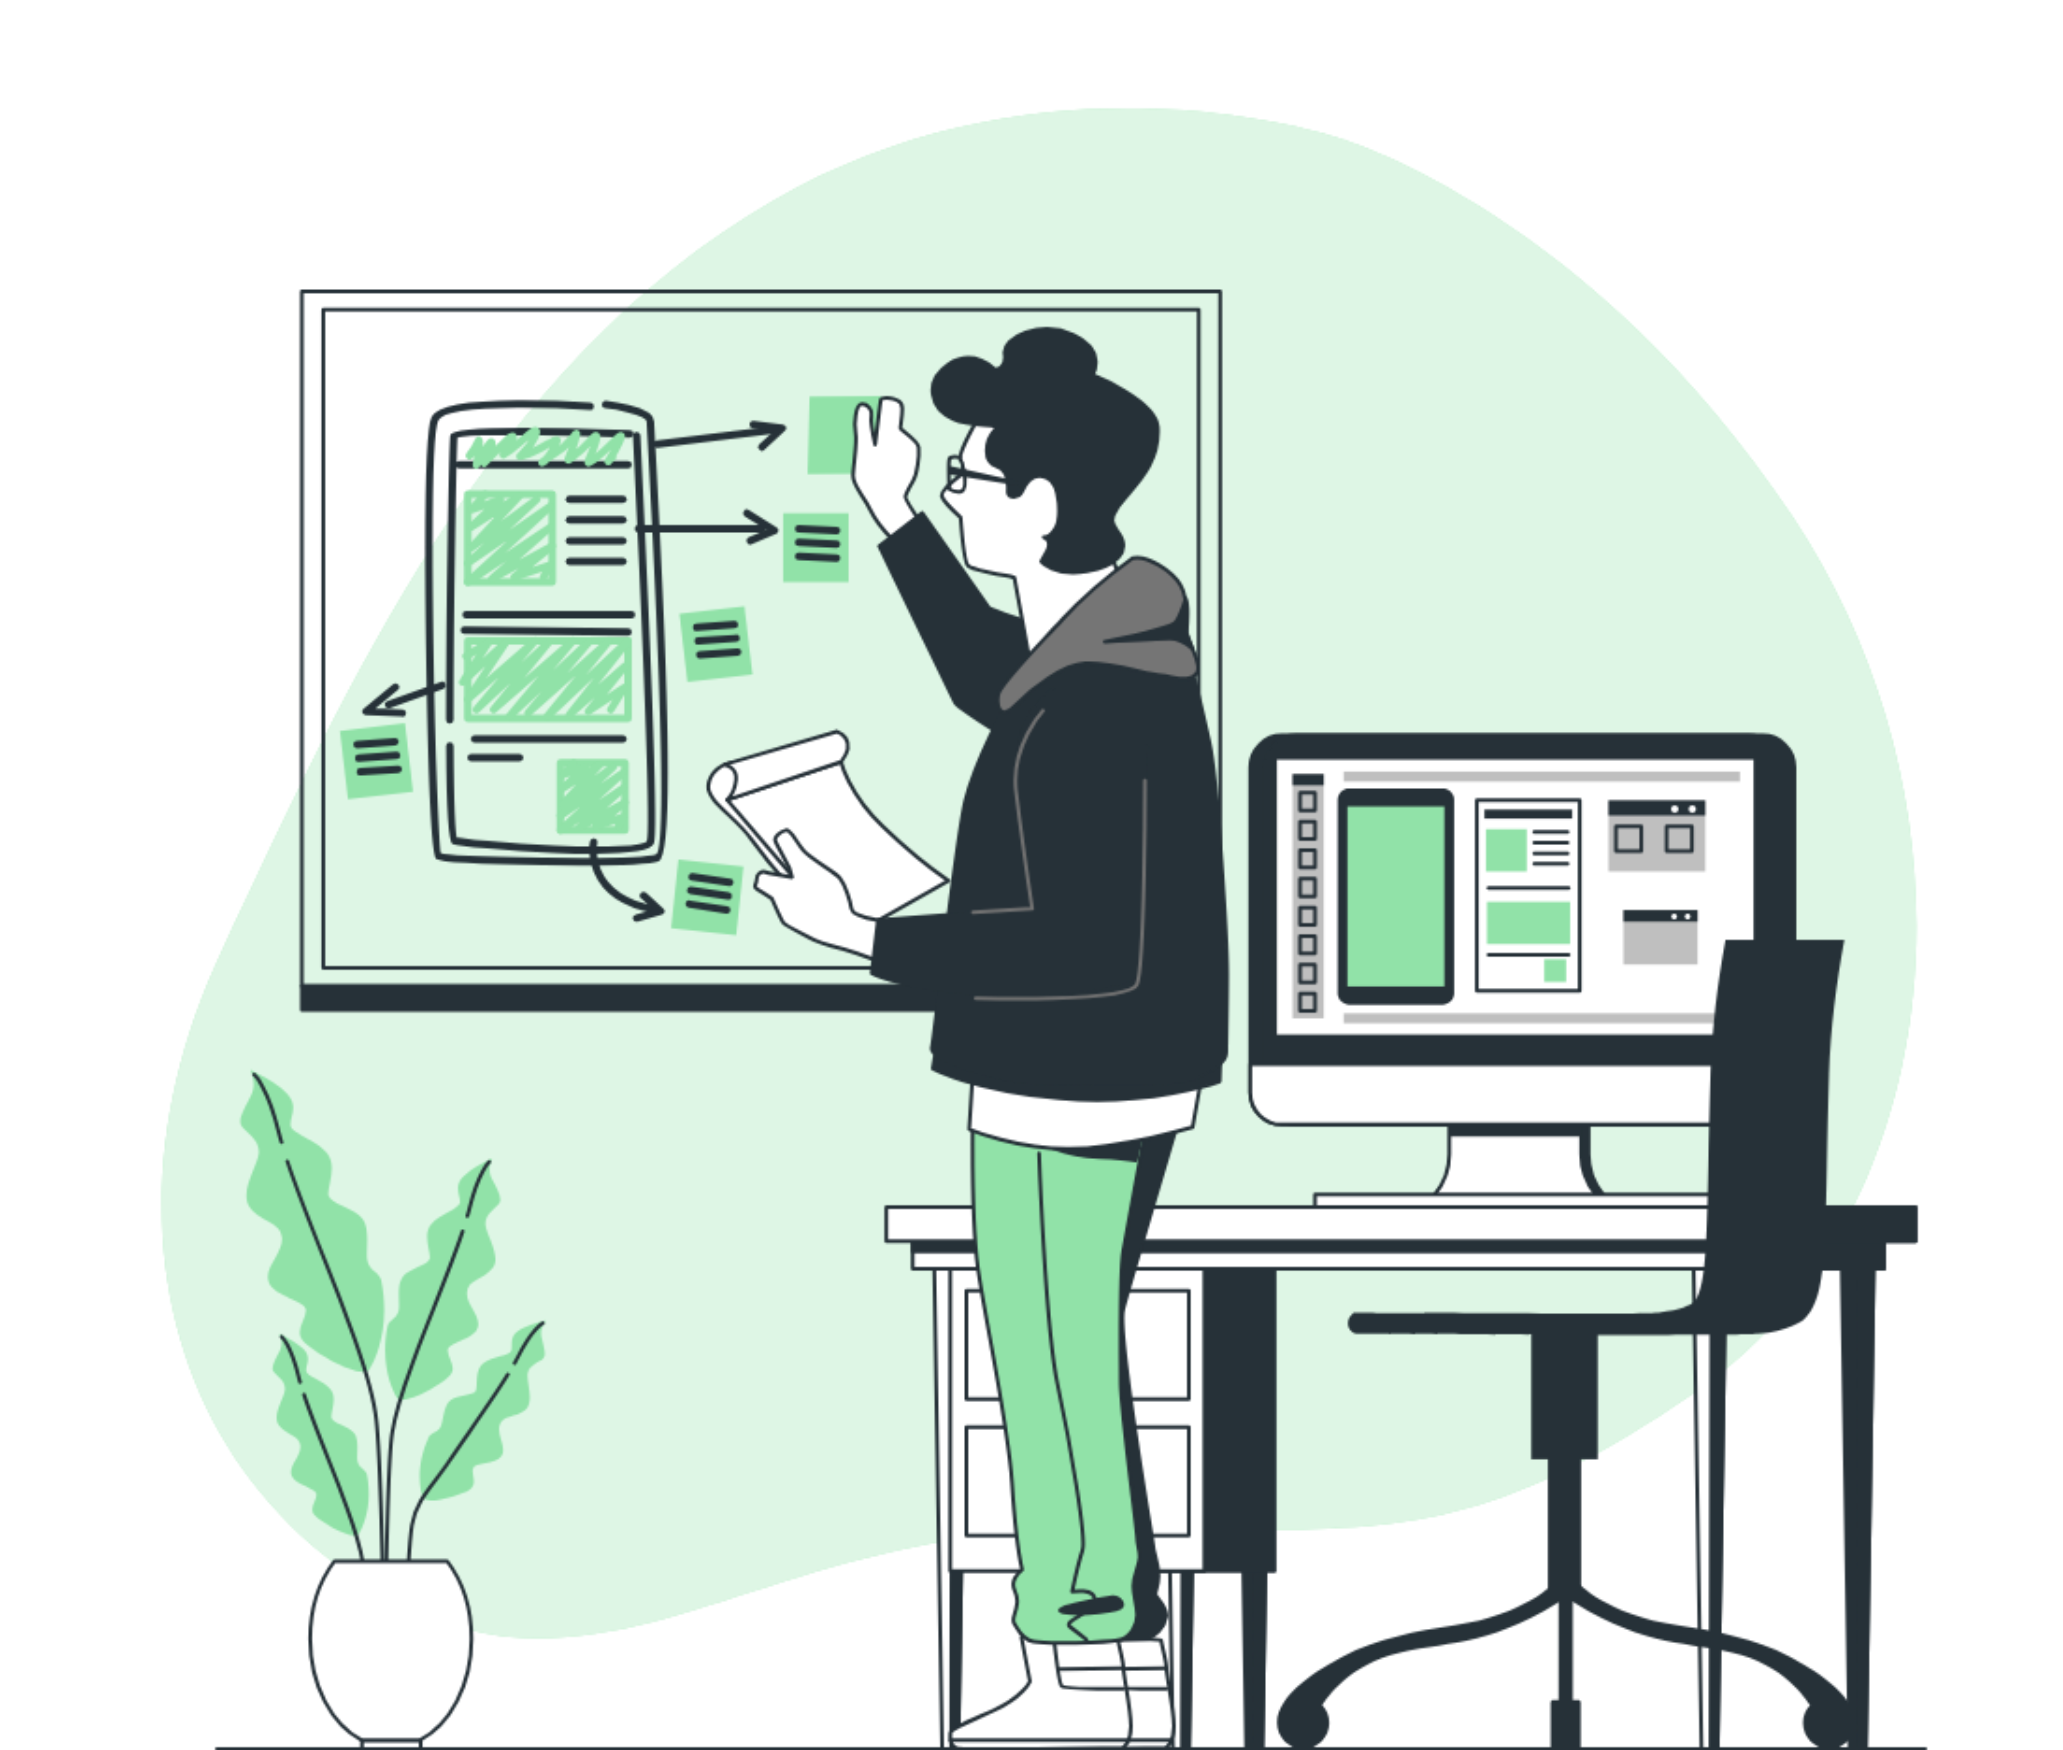
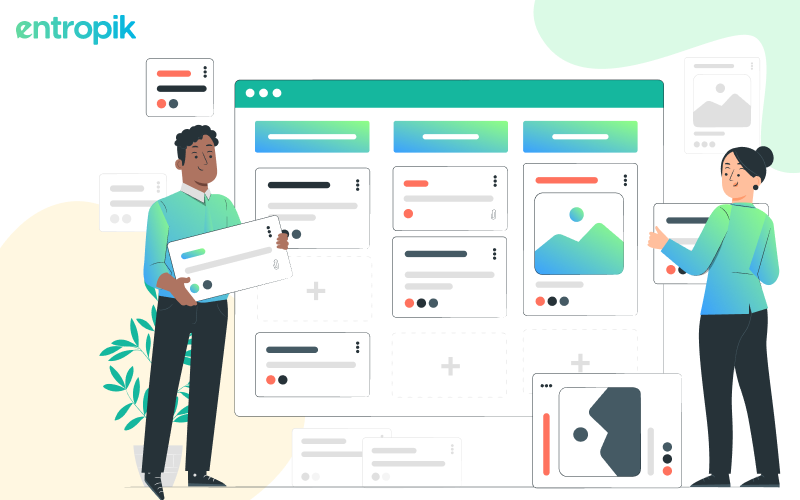
Here’s an example of an affinity diagram:

When Should You Use Affinity Mapping?
A simple and crisp answer is that affinity diagrams should be done after your brainstorming session.
Instead of being used as a tool for generating ideas, affinity diagrams organize, consolidate, and act upon the ideas generated during the brainstorming exercise.
An affinity map proves to be valuable under the following circumstances:
- Your brainstorming session has concluded.
- You are addressing a complex problem.
- There is a substantial volume of ideas or a significant amount of data to manage.
- You are keen on thinking creatively and exploring unconventional solutions.
Imagine an affinity diagram as a tool that brings structure to chaos. Rather than navigating aimlessly through a vast amount of information, this tool makes the data more manageable and understandable. Consequently, it transforms information into actionable insights.
How Can Affinity Mapping Help with UX Research?

According to a study by PwC, 32% of users would leave a brand they loved after just one bad experience. Utilizing an affinity diagram allows for a deeper understanding of user experience (UX). Here is how affinity mapping can help you organize your UX research:
1. Categorize similar ideas, themes, and pain points
Affinity mapping allows you to group similar ideas, themes, and pain points identified during UX research. This categorization simplifies the understanding of user feedback and data.
2. Discover hidden connections and unexpected insights
By visually organizing information, affinity mapping helps researchers uncover hidden connections and unexpected insights that may not be immediately apparent. This fosters a deeper understanding of user experiences.
3. Identify the most frequent and impactful issues
The grouping process makes common patterns and frequently mentioned issues more noticeable. This identification of prevalent themes assists in prioritizing and addressing the most impactful issues for users.
4. Collaborative exploration of research findings
Affinity mapping helps in the collaborative exploration process of research findings. Team members can collectively analyze, discuss, and interpret the data, ensuring that everyone has a complete understanding and different points of view are considered.
5. Better user experience
Ultimately, the insights gained through affinity mapping create a better user experience for everyone. The UX design can be enhanced by addressing key issues and understanding user needs, resulting in a more user-friendly product or service.
Why Affinity Mapping?

1. Helps you understand your users
Affinity mapping helps you understand your users better by categorizing and visualizing their feedback and ideas. This organized approach provides valuable insights into user preferences and pain points.
2. Promotes effective teamwork
The affinity mapping process encourages teamwork, as group members collaborate as a single unit and analyze data. This collaborative effort ensures that diverse perspectives are considered from different points of view, leading to more comprehensive and well-rounded outcomes.
3. Simple data organization
Affinity mapping simplifies the organization of complex data. Grouping related information together transforms scattered data into a structured and easily understandable format, aiding in efficient analysis and decision-making.
4. Fix the problems according to the priority
By identifying patterns and common themes, affinity mapping helps prioritize issues. This allows teams to address the most significant problems first, ensuring that efforts are directed toward resolving users' key challenges.
{{cta-trial}}
7-Step Process to Do Affinity Mapping
Here is how Affinity mapping can be done using four simple steps:
Step 1: Invite a diverse group
Gather a diverse team with varied mindsets and perspectives for a fruitful brainstorming session. Include individuals from different departments and levels and those unfamiliar with the problem to avoid groupthink.
Step 2: Assign a team leader
Designate a leader with strong listening, analytical, and communication skills to guide the brainstorming session effectively. This role ensures a focused and productive discussion.
Step 3: Prepare supplies and space
Set up a distraction-free space for collaboration. If meeting in person, have sticky notes and pens ready. For virtual meetings, use online templates and virtual sticky notes.
Step 4: Collect the data you want to organize
This is the point where you gather all the information or ideas related to your project or topic. It could be feedback, observations, or any relevant data that you want to organize and make sense of.
Step 5: Record the information on sticky notes or online templates
Once you have your data, transfer each piece of information onto individual sticky notes or templates that can be found on the internet. This helps break down complex information into manageable chunks and makes it easy to understand.
Step 6: Group notes that are related
Look for similarities or connections among the sticky notes or in the online templates and group together those that share common themes or ideas. This step helps in visually organizing the information and identifying patterns.
Step 7: Discuss and analyze the emerging themes
After grouping the notes, engage in discussions with your team or stakeholders. Analyze the emerging themes or patterns. This collaborative analysis helps to gain different perspectives, refine groupings, and draw meaningful insights from the organized information.
Qatalyst’s Card Sorting and Tree Testing for Better UX
Affinity mapping is a strategic method which involves the collaborative grouping and categorization of related ideas or data to identify patterns and relationships. Whereas, card sorting is a method used to organize and categorize individual items or concepts. Both card sorting and affinity mapping involve grouping and organizing information collaboratively.
Leverage Qatalyst’s Card Sorting block that can help you gain valuable insights into how users perceive relationships between concepts and how they expect information to be organized.
These insights, in turn, inform the design and structure of websites, applications, and other information systems, leading to enhanced usability and an improved user experience.
You can also use the Tree Testing block in Qatalyst, which helps in addressing the fundamental question, "Can users find what they are looking for?" This research technique allows us to evaluate the effectiveness of our information architecture and assess whether users can navigate through the content intuitively, locate specific topics, and comprehend the overall structure of our product.

Final Words
Affinity mapping emerges as a powerful tool with multifaceted benefits. By fostering a deeper understanding of users, promoting effective teamwork, simplifying data organization, and prioritizing the resolution of significant issues, affinity mapping proves instrumental in elevating the research and decision-making processes.
For better user experience analysis, you can use Qatalyst, an AI-integrated user research platform designed to help you make informed decisions about your products and services. Leverage the card sorting block to organize information on cards to find patterns, relationships and hierarchy, and the tree testing block to evaluate information architecture by assessing user’s ability to locate items in a hierarchical structure.
With Qatalyst, you can conduct moderated and unmoderated user research using various tools and technologies, including eye tracking, facial coding, and mouse movement. With our platform, you can gain a deep understanding of your users, their behaviors, and preferences, enabling you to create products and services that meet their needs and exceed their expectations.


.jpg)